Figure 2.
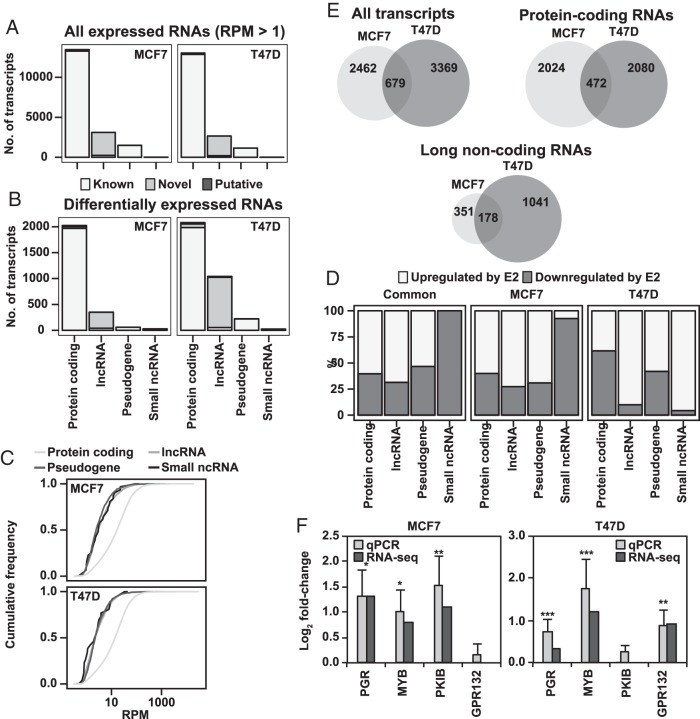
E2 treatment induces changes in both the coding and noncoding transcriptome of MCF7 and T47D cells. A, Most detected RNAs are protein coding. Distribution of all expressed transcripts (RPM ≥ 1 in all replicates of both treatments), in either cell line among protein-coding mRNAs, lncRNA, pseudogenes, and small ncRNAs. Transcript type and status as defined by Gencode 19. B, A relatively large proportion of estrogen-regulated transcripts are lncRNAs. As in A but for all differentially expressed transcripts in either cell line. C, lncRNAs and pseudogenes are poorly expressed. Graphs showing expression levels of the different transcript types as cumulative frequency distribution, representative plot from analysis of 1 biological replicate shown. RPM values are on log scale. D, Most protein-coding, lncRNAs, and pseudogenes are up-regulated. Fraction of up- and down-regulated genes, respectively, by transcript type in differentially expressed genes common for both cell lines, or for the set of differentially expressed gens for either cell line. E, Hundreds of protein-coding and lncRNAs are regulated by E2 in both MCF7 and T47D. Venn diagrams showing overlap of differentially expressed genes for the total sets from both cell lines, as well as for only protein- and noncoding transcripts. F, qPCR data confirm RNA-seq data on E2 regulation of select genes for both cell lines. The 2 bars represent detected fold change values for E2 treatment vs vehicle, as measured by qPCR (n = 3) and RNA-seq, respectively. Error bars show SD, and significance calculated by Student's t test is indicated by *, P < .05; **, P < .01; ***, P < .001.

