Figure 3.
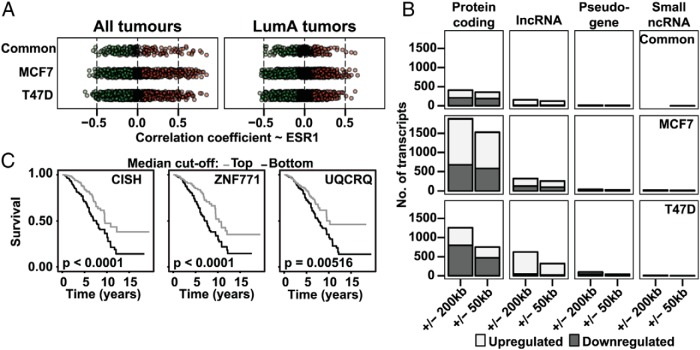
E2-regulated genes correlate with clinical ERα expression and have genomic ERα-binding sites. A, Plot showing the correlation coefficient for the differentially expressed protein-coding genes and ERα mRNA in clinical tumors from TCGA's BC RNA-seq data. Nonsignificant correlations illustrated in black, positively correlated and E2-induced genes in red, and negatively correlated and E2-repressed genes in green. B, Graphs showing the number of transcripts, by type, that possess an ERα-binding site within 200 or 50 kb of the TSS. Cell line-specific sets of differentially expressed transcripts were analyzed against ERα-binding data from respective cell line, whereas the common set incorporates data from both cell lines (40, 41). C, OS for TCGA's BRCA cohort, according to expression of indicated genes. The patient cohort was stratified at the median expression value of the genes, and the P values indicate log-rank test P values.

