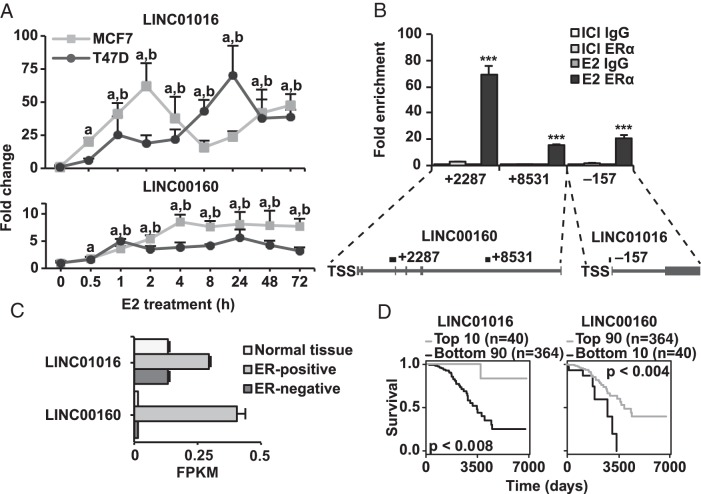
Figure 4.
ERα regulates lncRNAs directly through genomic binding. A, qPCR data showing the E2 induced mRNA levels of the lncRNAs LNC01016 and LNC00160 over 72 hours of treatment. Line graphs fold change over vehicle treatment in MCF7 and T47D cells. The rapid regulation at 30 minutes indicates direct regulation. Error bars show SD, and significance compared with vehicle treatment at 0 hours calculated by Student's t test P = .05 indicated by a and b for MCF7 and T47D, respectively. B, ChIP-qPCR verifying the binding of ERα at genomic binding sites illustrated below, as previously indicated by published ChIP followed by sequencing (ChIP-seq) data. Experiments carried out in triplicate in MCF7, indicating fold enrichment over respective IgG control ChIP. Error bars show SD, and significance calculated by Student's t test indicated by *, P < .05; **, P < .01; ***, P < .001. C, Expression levels of LINC01016 and LINC00160 in normal tissue and ER-positive and ER-negative breast tumors in TCGA's BC cohort. Error bars show SEM. D, Kaplan-Meier curves showing association of expression of LINC01016 and LINC00160 with survival in luminal-A subtype BC patients in TCGA's BC cohort. Expression cut-offs and P values from log-rank test indicated in figure.

