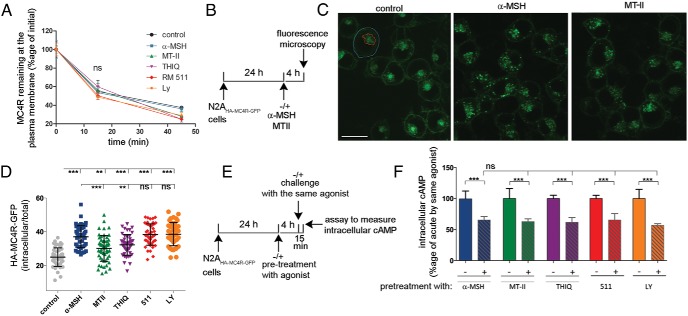
Figure 8.
The extent by which HA-MC4R-GFP redistributes to the intracellular localization in response to prolonged treatment with synthetic agonist is specific to the type of agonist being used. A, Live N2AHA-MC4R-GFP cells were treated with no additions or exposed to α-MSH and MTII (200nM), THIQ (1μM), BIM-22511 and LY2112688 (100nM), and to POD-conjugated anti-HA antibodies at 4°C. Cells were washed and transferred at 37°C in the presence of agonist to measure internalization of the pool of HA-MC4R-GFP by monitoring the abundance of agonist-free and agonist-bound receptor at the cell surface as outlined in Materials and Methods. B, N2AHA-MC4R-GFP cells are treated at 37°C for 4 hours with no additions or with α-MSH (1μM) and MTII (500nM) as shown in the schematic. C, Confocal images of live N2AHA-MC4R-GFP cells treated as in B and transferred to a heated stage at 37°C for confocal microscopy. Scale bar, 10 μm; blue tracing, ROI of intracellular GFP fluorescence; red tracing, ROI of GFP fluorescence within the cell perimeter. D, Experiments as outlined in B were carried out exposing cells to α-MSH (1μM), MTII (500nM), THIQ (1μM), and BIM-22511 and LY2112688 (500nM) for 4 hours. Changes in the cellular distribution of HA-MC4R-GFP upon prolonged agonist exposure were monitored by measuring the ratio intracellular GFP fluorescence intensity to total GFP fluorescence intensity as outlined in Materials and Methods. Each symbol corresponds to a single cell (∼60 cells per condition). E, Schematic of experiments where N2AHA-MC4R-GFP cells were pretreated at 37°C with no additions or with α-MSH, MTII, THIQ, BIM-22511, and LY2112688 for 4 hours as in Figure 6F. F, HA-MC4R-GFP desensitization is monitored by the cAMP levels in N2AHA-MC4R-GFP cells pretreated with the indicated agonists expressed as a percentage of that of control cells pretreated in the absence of MC4R ligands.

