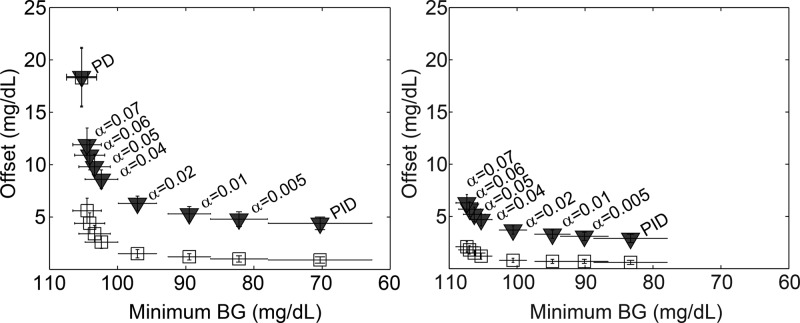
Figure 6.
Offset 11 h (black triangles) and 20 h (white squares) after a decrease in insulin sensitivity plotted versus minimum BG after a 100 g-CHO meal for varying values of anti-reset windup parameter α. The left panel shows the offset versus minimum BG for PID+AWP, while the right shows the results for PID+AWP+IFB (γ = 0.5). The data points represent the 10-subject mean and the error bars show standard deviation.

