
Figure 8.
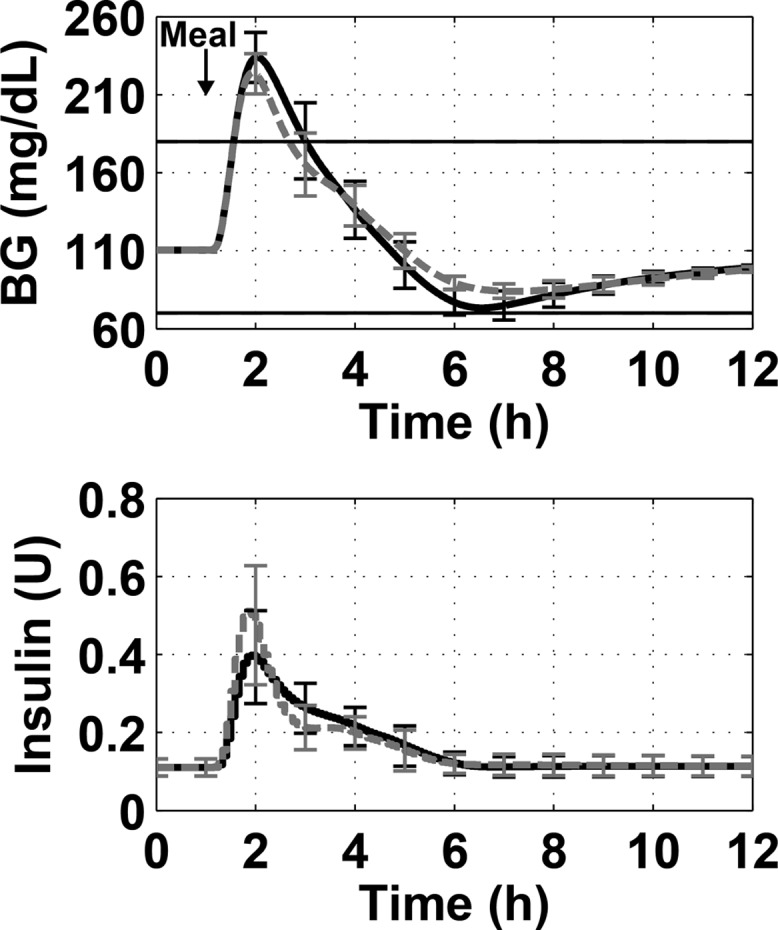
Demonstration of best insulin feedback tuning (dashed gray line) compared to unmodified PID control (solid black line) for a 100 g-CHO meal. The top panel shows the blood glucose concentration over time and the bottom panel shows the insulin delivered. The lines show the mean of the 10 subjects, and the error bars show standard deviation.