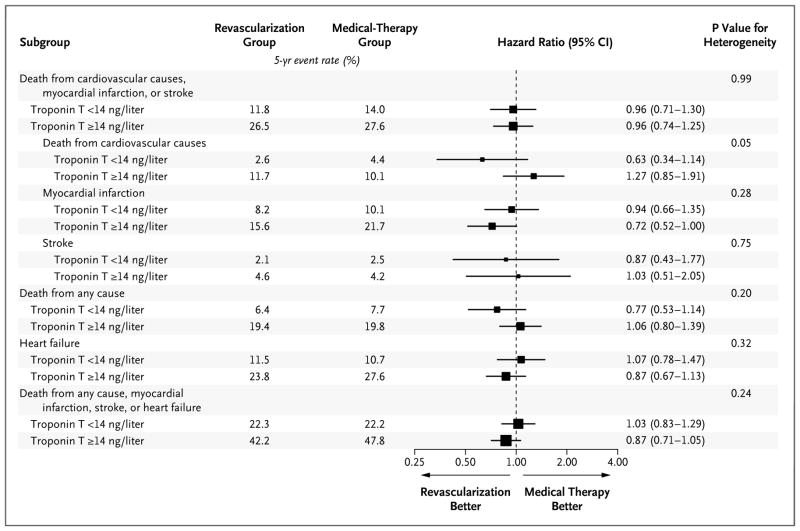
Figure 2. Hazard Ratios for the Primary Composite End Point and Selected Secondary End Points.
Data are shown for the patients who were randomly assigned to either prompt revascularization plus intensive medical therapy (revascularization group) or intensive medical therapy alone (medical-therapy group), stratified according to a normal (<14 ng per liter) or an abnormal (≥14 ng per liter) high-sensitivity cardiac troponin T concentration at baseline. The size of the boxes is proportional to the size of the subgroups.

