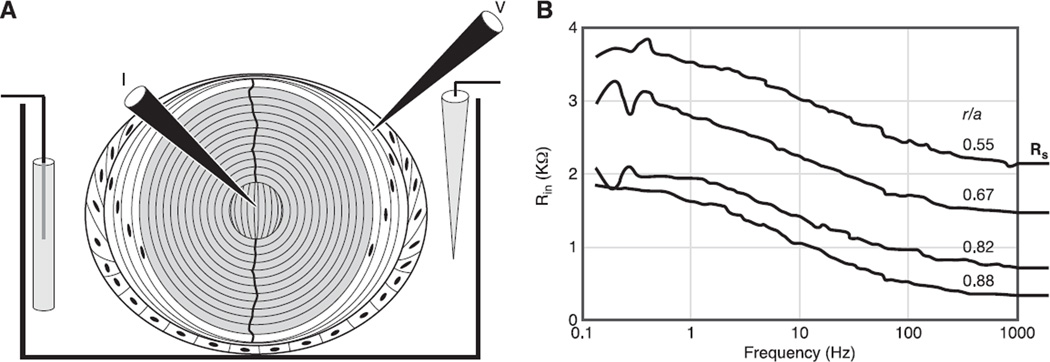
Fig. 6.
The methodology of whole lens impedance studies. A: the positioning of microelectrodes within the lens to inject current (I) and measure the induced voltage (V). The voltage microelectrode is moved to different locations to determine the spatial distribution of transport properties such as gap junction coupling conductance. B: typical records of the input impedance (Rin) as a function of the sinusoidal frequency of the injected current. The data were recorded at four depths into the lens, starting at 12% of the distance into the lens from the surface (r/a = 0.88), and culminating at 45% of the distance into the lens from the surface, where a is the radius and r is the distance from the center of the lens. Note the high frequencies, the input impedance asymptotes to a frequency-independent series resistance, RS. As described in the text, RS is proportional to the resistance of all the gap junctions between the point of voltage recording and the lens surface.

