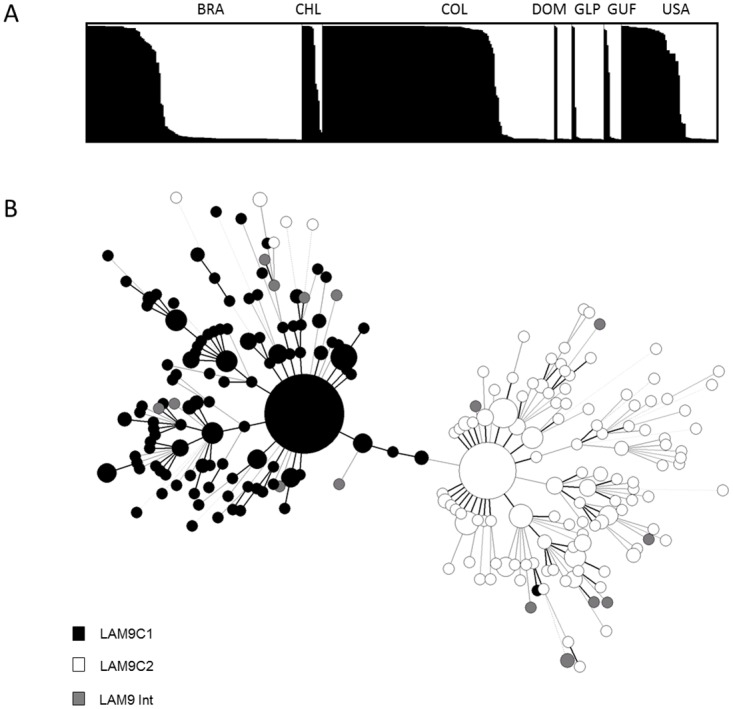
Fig 3. Evolutionary relationships of the LAM9 sublineage isolates (n = 450).

(A) Geographical distribution and LAM9C1 and C2 isolates defined by Bayesian cluster analysis using STRUCTURE software run on 12-loci MIRU-VNTRs. Each of the strains is represented by a thin vertical line, partitioned into black or white segments that represent the strains estimated proportion of membership in clusters LAM9C1 and LAM9C2 respectively. (B) MST analysis on combined spoligotyping and MIRU-VNTR data for strains prelabeled as LAM9C1 (n = 226) and C2 (n = 208) based on previous STRUCTURE analysis (strains in intermediate position between C1 and C2 are indicated as LAM9 Int, n = 16). The complexity of the lines denotes the number of allele/spacer changes between two patterns while the size of the circle is proportional to the total number of isolates sharing same pattern. Country codes are shown as ISO 3166–1 alpha-3 code.
