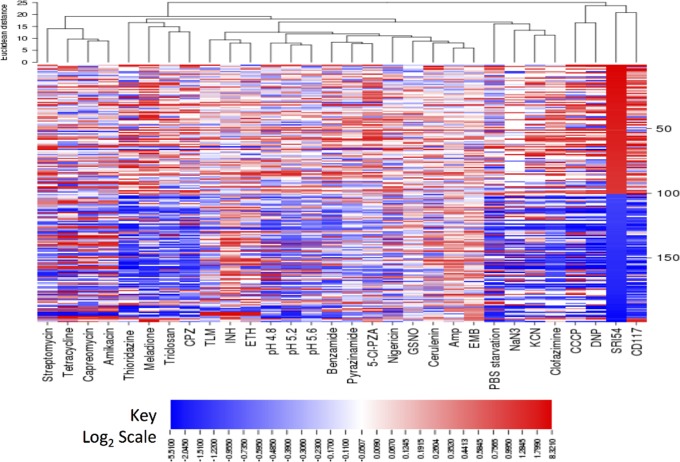
Fig 4. Mtb transcriptional response to SRI54 as compared to other small molecule antituberculars and environmental stresses.
100 SRI54 most induced and repressed genes (top-bottom) are clustered with responses to other treatments (left-right). The top dendrogram indicates relatedness of the Mtb perturbations based on gene clusters. Red indicates increase, blue indicates decrease and white no change in expression versus DMSO treatment. Amp, ampicillin; EMB, ethambutol; TLM, thiolactomycin; INH, isoniazid; ETH, ethionamide; 5-Cl-PZA, 5-chloropyrazinamide, CPZ, chlorpromazine; CCCP, carbonyl cyanide 3-chlorophenylhydrazone; GSNO, S-nitrosoglutathione; DNP, 2,4-dinitrophenol.

