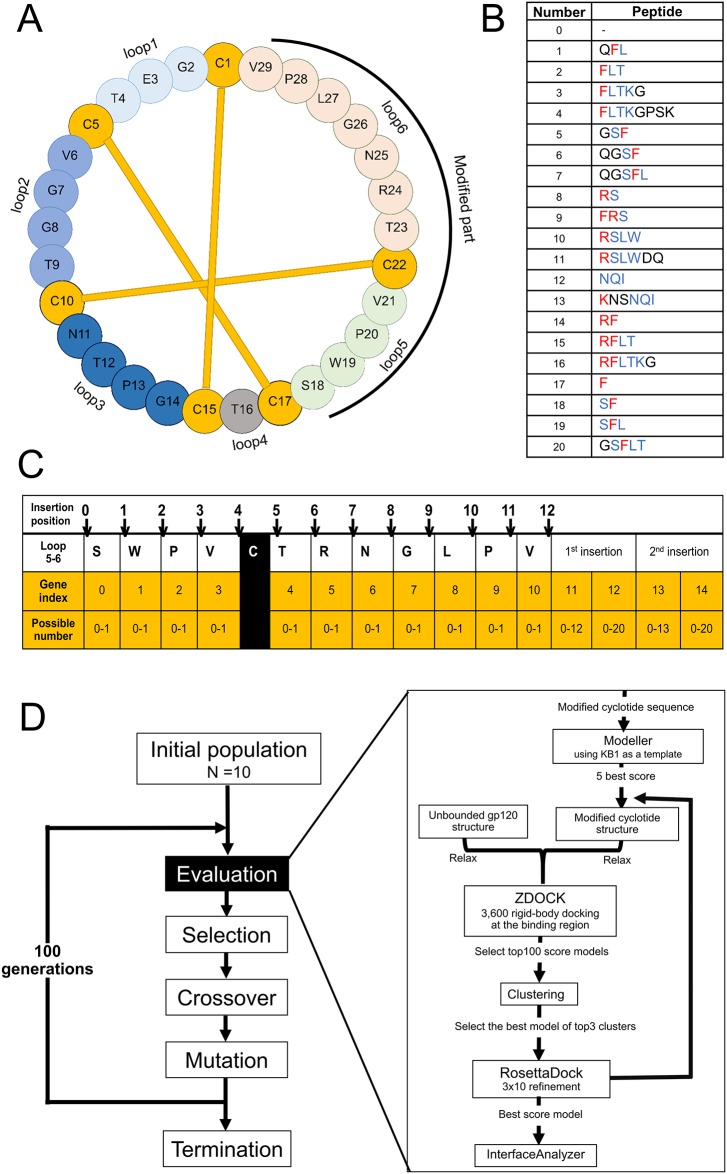
Fig 1. Genetic algorithm schema for modifying the KB1 sequence.
(A) Native KB1 primary sequence. The disulfide bonds are linked by yellow lines. (B) Hotspot-containing peptide library. Residues in red show the contribution to binding energy lower than -2.0 kcal/mol; blue, binding energy in the range of -0.5 to -2.0 kcal/mol; black, binding energy higher than -0.5 kcal/mol (estimated by Anchor). (C) Chromosome design and configuration. Chromosome emphasized by yellow represents the operation on loop 5 and loop 6 of KB1. (D) Molecular pipeline of the GA process and evaluation. After the initial chromosomes are generated, the evaluation method (right box), which contains the molecular modelling pipeline, is implemented. The GA is processed with 100 generations and 10 individuals per generation.

