
Figure 1.
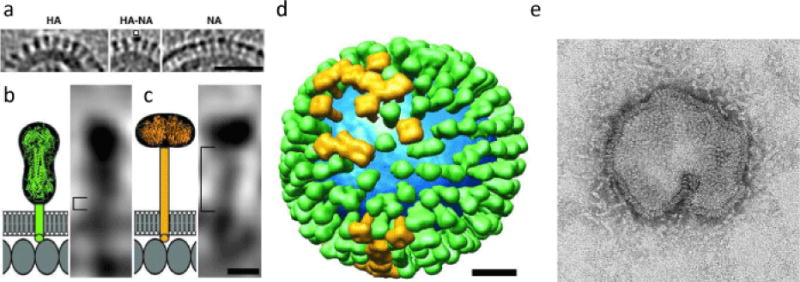
Distributions and shape-based differentiation of HA and NA spikes. (a) HA cluster (Left); single NA (marked) in a cluster of HAs (Center); and cluster of mainly NA spikes (Right). (Scale bar, 50 nm) (b and c) The stem lengths of HA and NA (square brackets in b and c, respectively). The structures of the stems, trans-membrane domains, and C-terminal endodomain tails are shown schematically. Molecules in the matrix layer are shown as oval shapes in a monolayer with a spacing of ≈ 4 nm (Scale bar, 5 nm.) (d) Model of the distribution of glycoprotein HA (green) and NA (gold) on a single influenza virion. The lipid bilayer is blue. (Scale bar 20 nm.) From [9], with publisher’s permission (Copyright (2006) National Academy of Sciences, U.S.A.). (e) Spherical/pleomorphic influenza A H7N9 virus particle, by electron microscopy. From http://www.cdc.gov/flu/avianflu/h7n9-images.htm.