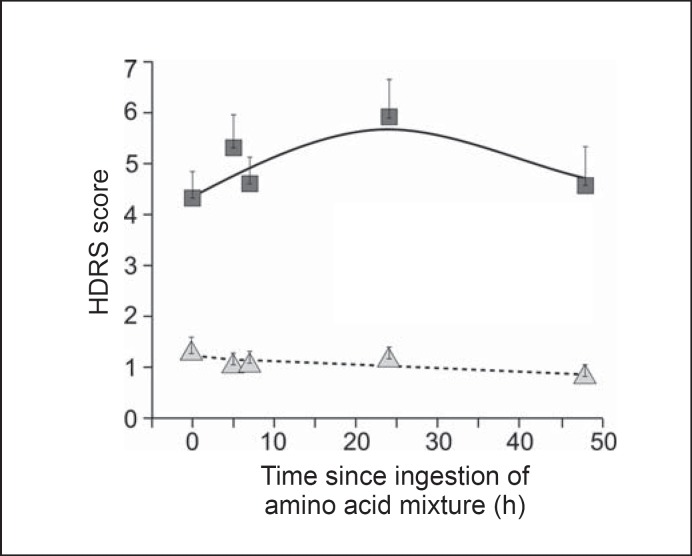
Fig. 2.
Depressive response during ATD in latent trajectory groups (n = 64). The figure displays both the actual mean HDRS scores for ATD responders (squares) and non-responders (triangles) at each time point and the model estimates for responders (solid line) and non-responders (dotted line) utilizing generalized linear regression model with generalized estimating equations.

