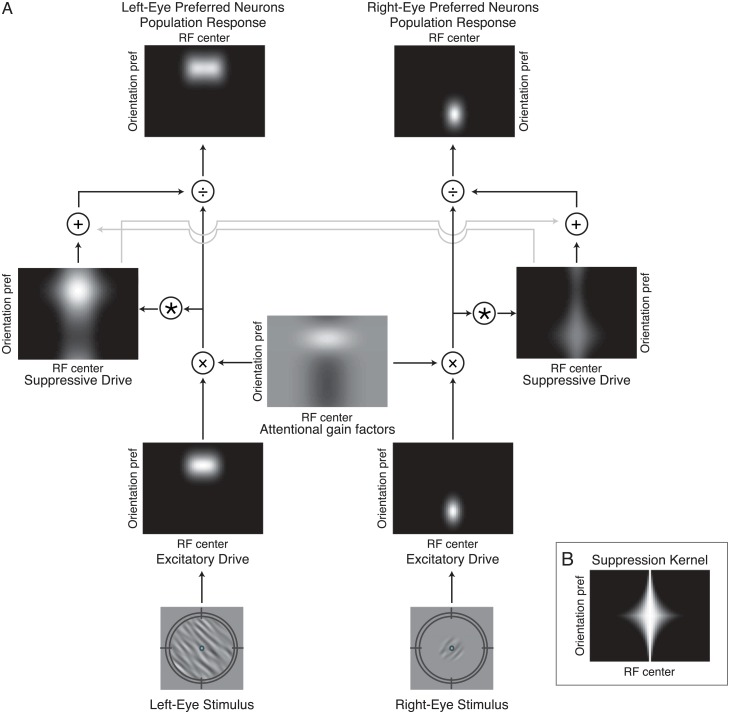
Fig 3. Model.
A. The model simulates the firing rates of two populations of monocular neurons, responsive to stimuli presented to each of the two eyes, with a range of receptive field locations and orientation preferences. Depicted is an example of the feature-specific (FS) model, in which the two monocular neural populations share the same attentional gain factors, and stimulus-driven attention is selective for the orientation and size of the competitor. Bottom row, example stimuli. Target presented to right eye and large competitor presented to the left eye. Second row (from the bottom), excitatory drive. Simulated neurons are arranged in each panel according to their receptive field center (horizontal position) and preferred orientation (vertical position). Brightness at each location in the image corresponds to the excitatory drive to a single neuron. Third row, attentional gain factors. The attentional gains determine the strength of the attentional modulation as a function of receptive field center and orientation preference. Mid-gray indicates a value of 1, white indicates a value larger than 1 (attentional enhancement), and black indicates a value smaller than 1 (attentional suppression). Fourth row, suppressive drive computed from the product of the excitatory drive and the attention gain factors, and then pooled over space and orientation (see panel B), and across the two eyes (light gray arrows). Top row, output firing rates. The excitatory drive is multiplied by the attention gain factors and divided by the suppressive drive. B. The suppression kernel. The suppressive drive is pooled over space and orientation by convolving the attention-modulated excitatory drive with the suppression kernel.

