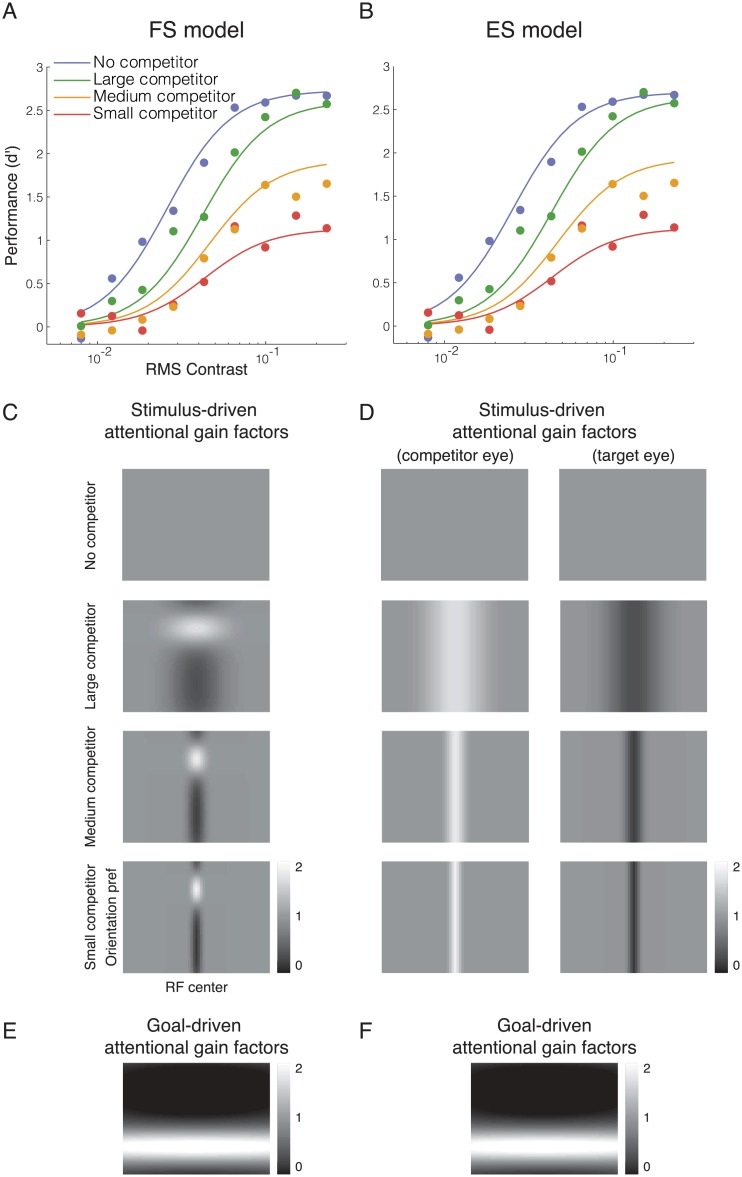
Fig 4. Model fits for data from Ling and Blake (2012).
A and B. FS and ES model fits. Filled dots, psychophysical performance averaged across observers. Curves, best fits by each of the two models (parameter values reported in Table 2). C and D. The competitor-driven attentional gain factors estimated by the FS and ES models. E and F. The task-driven attentional gain factors estimated by the two models.

