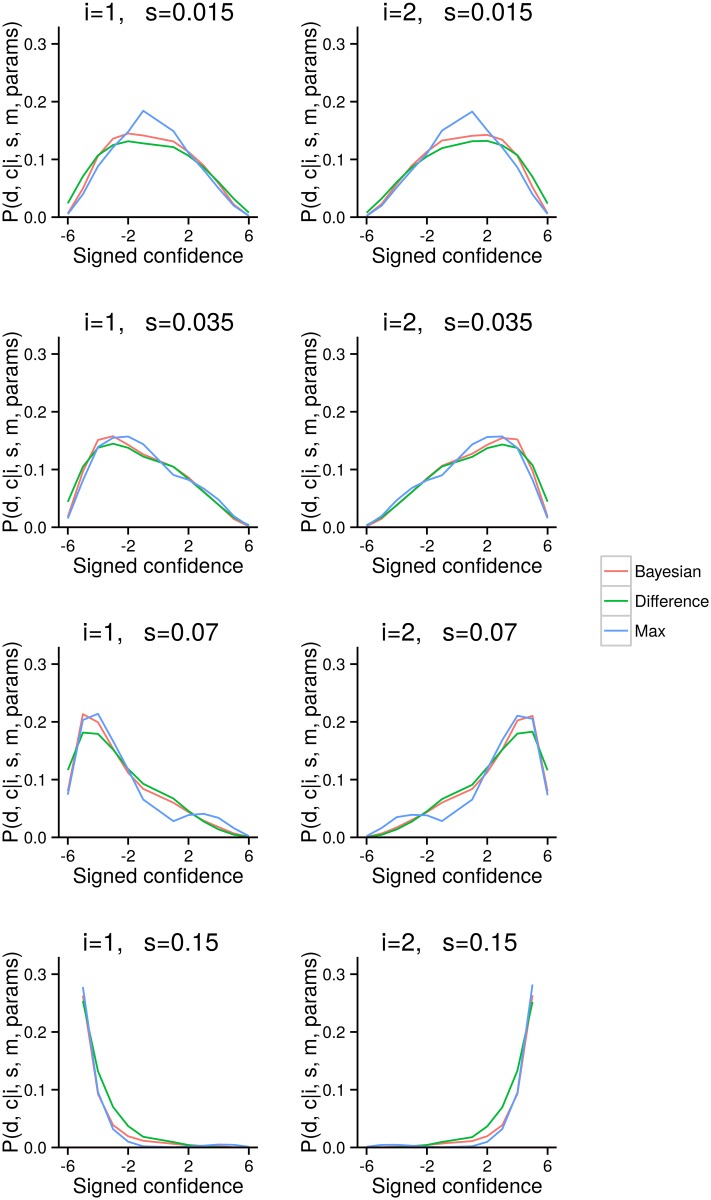
Fig 8. Different models lead to different distributions over confidence.
Same as Fig 6, but displaying theoretical distributions induced by the three different models. The parameters were not fit to data; instead, they were set to fixed (but reasonable) values: σ = 0.07, b = 0 and p d, c = 1/12.

