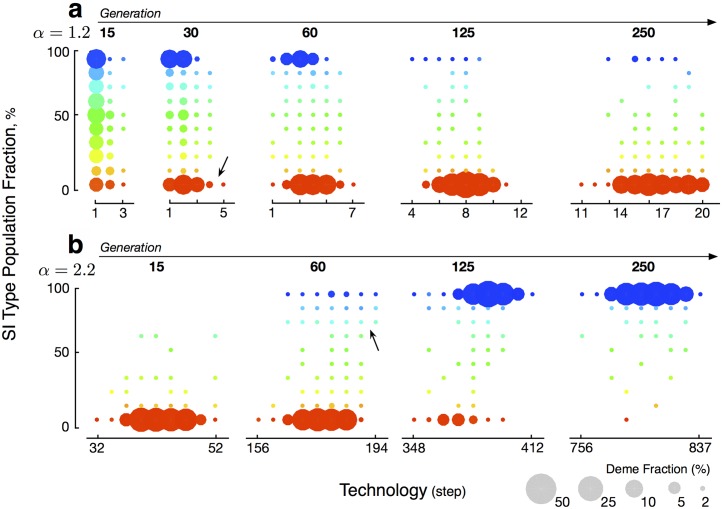
Fig 3. Demes with given fraction of SI type individuals and technology level per generation under benchmark conditions.
a: α = 1.2, starting from a state in which each individual is SI or N type with equal probability, b: α = 2.2, starting from a state in which no individuals are SI type. Arrows indicate where demes rich in N and SI types respectively gain a technological advantage.

