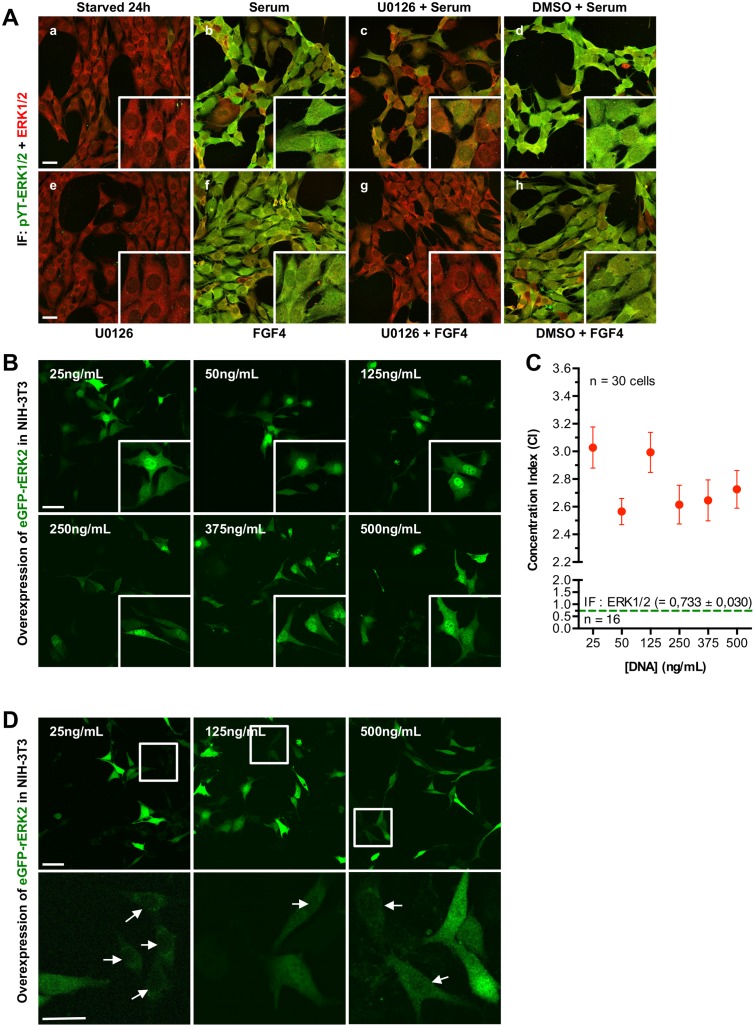
Fig 1. Overexpression of eGFP-rERK2 induces nuclear accumulation of eGFP-rERK2.
(A) NIH3T3 cells were serum-starved for 24 h (a) and then stimulated with 10% serum (b) or 100 ng/mL FGF4 (f). In other conditions, cells were pretreated with 20 μM U0126 (c, e, g) or vehicle DMSO (d, h) for 30 min before stimulation with 10% serum (c, d) or FGF4 (g, h). Cells were fixed, processed for double immunofluorescence with antibodies against total ERK1/2 and activated di-phosphorylated YT-ERK1/2, and then imaged by confocal microscopy. A maximum-intensity projection of a 5-μm thick z-stack (step size: 0.3 μm) for each overlapping image is shown. (B) NIH-3T3 cells were transiently transfected with increasing amounts of eGFP-rERK2 plasmid as indicated on the top left of each image, serum-starved for 24 h, fixed, and then imaged by confocal microscopy. The total amount of DNA was kept at 500 ng/mL of medium in all conditions. Higher magnification images of representative eGFP-rERK2 localization are shown in white squares (bottom right). Scale bars: 50 μm. (C) Relationship between the concentration of eGFP-rERK2 plasmid and the concentration index (CI). Higher CI values reflect greater accumulation of eGFP-ERK2 in the nucleus. Average CI was determined by examination of at least 30 randomly selected cells for each of the transfected conditions from two independent experiments. Average CI value for endogenous ERK1/2 in serum-starved NIH-3T3 is also shown (green dotted line). (D) NIH-3T3 cells transfected with 25, 125 or 500 ng/mL of eGFP-rERK2 were observed under severe imaging conditions to visualize cells that express very low level of eGFP-rERK2 protein (upper panel, white squares). Higher magnification images of these cells exhibiting mainly cytoplasmic localization of eGFP-rERK2 are also shown (bottom panel, white arrows). Scale bars: 50 μm.

