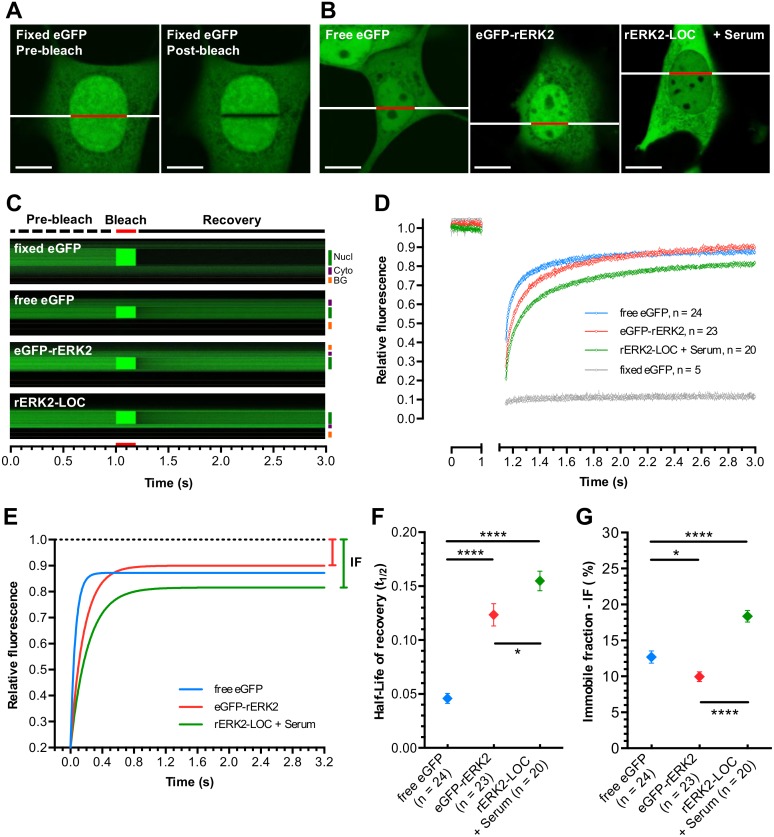
Fig 4. Mobility of rERK2-LOC measured by high-speed FRAP.
(A) eGFP-transfected NIH-3T3 cells were fixed. Individual living cells were imaged as described in the Materials and Methods section. Image sequences before (left) and after (right) photobleaching are shown. Scale bars: 10 μm. (B) NIH-3T3 cells were transfected with eGFP (left), eGFP-rERK2 (middle) or rERK2-LOC (right) and then serum starved for 24 h. Cells overexpressing rERK2-LOC were stimulated with serum to trigger its nuclear translocation. Bleached ROI correspond to the red lines drawn across the nuclei. Scale bars: 10 μm. (C) Representative kymograms (xt) of fluorescence intensity measured along the line (both red and white) across the selected cells for each experimental condition over-time are shown, indicating the FRAP measurement sequence: pre-bleach of 1 s (broken dark line), bleach of 150 ms (red lines) and post-bleach of 2 s (solid dark line). Correction for overall bleaching effects was applied. Nucl: nucleus (green line), Cyto: cytoplasm (purple line), BG: background (yellow line). (D-E) Curves of cumulative fluorescence recovery over time for fixed eGFP (grey curve), free eGFP (blue curve), overexpressed eGFP-rERK2 (red curve) and rERK2-LOC after serum stimulation (green curve, 8 min after serum stimulation) were normalized (D) and fitted (E). (F-G) Average half-life of recovery (t1/2) and immobile fraction (IF) calculation for cells serum-starved for 24 h and overexpressing free eGFP (blue symbol) or eGFP-rERK2 (red symbol), and serum-stimulated cells overexpressing rERK2-LOC (green symbol, 8 min after serum stimulation). At least two independent experiments were performed. The number of individual cells used for each condition is indicated above each symbol. Statistical significance was determined by a two-tailed unpaired t-test (ns, no significant; *, ≤ 0.05; ****, ≤ 0.0001).

