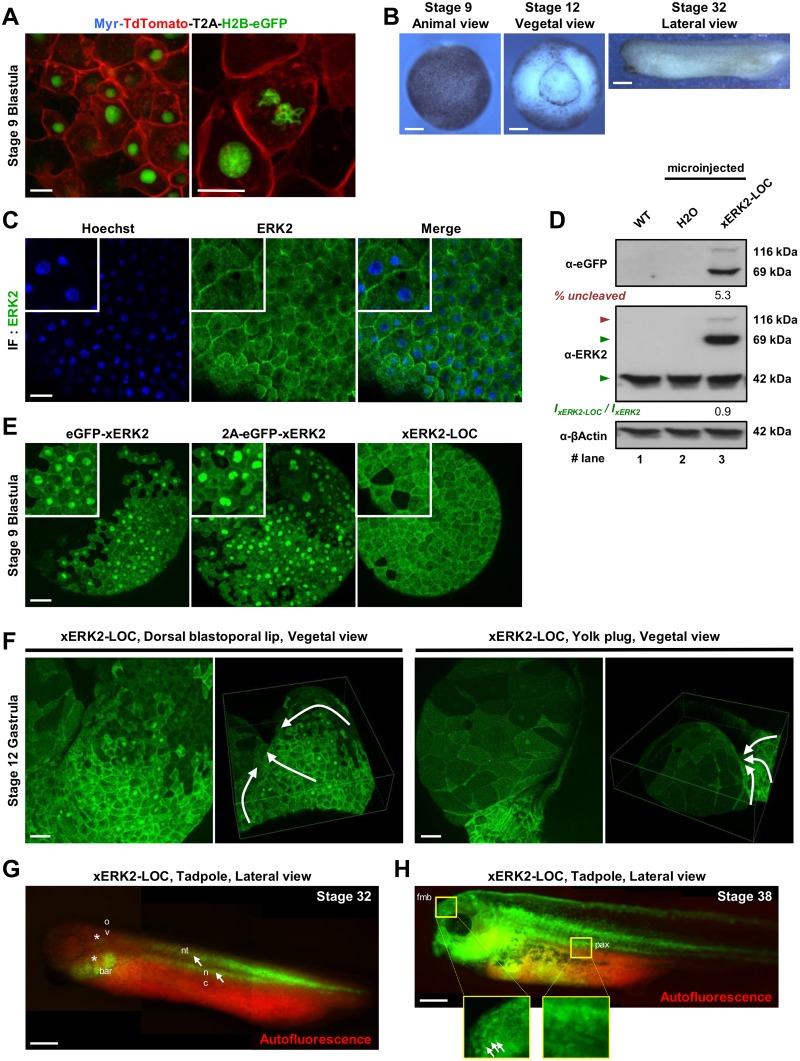
Fig 5. Spatiotemporal subcellular distribution of xERK2-LOC in living Xenopus laevis embryo.
(A) Embryos were injected with 500 ng of Myr-TdTomato-T2A-Histone2B-GFP mRNA. Maximum-intensity projection of a z-stack of 40 confocal images with a z-step of 0.59 μm is shown at 40X (left, scale bar: 10 μm) and at 63X magnification (right, scale bar: 20 μm). Pictures were merged to visualize Myr-mCherry at the plasma membrane and H2B-eGFP in the nucleus. (B) xERK2-LOC subcellular distribution was visualized at several stages of Xenopus laevis development (stage 9 blastula, stage 12 blastula and stage 32 tadpole). Scale bar: 200 μm. (C) Stage 9 embryos were fixed and processed for immunofluorescence with antibody against total ERK2 (green) and stained for DNA with Hoechst (blue) as described in the Materials and Methods section. Scale bar: 100 μm. (D) Protein extracts were prepared from uninjected (WT, lane 1), H2O injected (lane 2) and xERL2-LOC overexpressing embryos (lane 3) and immunoblotted with antibodies against GFP (top panel), ERK2 (middle panel) and β-actin (bottom panel). The percentage of uncleaved xERK2-LOC was measured by densitometry and is shown below the top panel in lane 3. The levels of overexpressed xERK2-LOC relative to endogenous ERK2 (green triangles, middle) are indicated below the blot as I xERK2-LOC / I xERK2. (E) Embryos were injected with 500 ng of eGFP-xERK2, 2A-eGFP-xERK2 (control) or xERK2-LOC mRNA. Projections of at least 60 confocal 0.7-μm sections of animal cells at stage 9 blastula are shown. Higher magnification images of representative subcellular distributions of xERK2 are shown in white squares (top left). Scale bar: 150 μm. (F) Monitoring of xERK2-LOC subcellular distribution in the cells of the dorsal blastoporal lip (left panel) and the yolk plug (right panel) in stage-12 gastrula. Projection and 3D reconstruction of z-series of 108 confocal 1.50-μm sections (left panel) and 86 confocal 1.00-μm sections (right panel) are shown. White arrows indicate the trajectories of the cells leading to a progressive internalization of the yolk plug. Scale bar: 150 μm. (G-H) Several images from different viewpoints were recorded and combined to create a whole image of the developing embryos expressing xERK2-LOC, head to the left, at stage 32 (G) and stage 38 (H) tadpoles. The spatiotemporal localization of xERK2-LOC (green) in the embryonic structures, enhanced by autofluorescence of embryo and yolk (red signal), corresponds to notochord (nc), neural tube (nt) (both white arrows), otic vesicle (ov) and branchial arch region (bar) (both white asterisks) (G). Higher magnification of the forebrain-midbrain boundary (fmb) and para-axial structures (pax) are shown in yellow squares (H). Small white arrows indicate xERK2-LOC nuclear accumulation in several cells of the forebrain-midbrain boundary. Scale bar: 500 μm. At least two independent experiments were performed from animal caps, fixed embryos, or live embryos, and at least ten embryos were imaged. Biochemical data are representative of at least two independent experiments.

