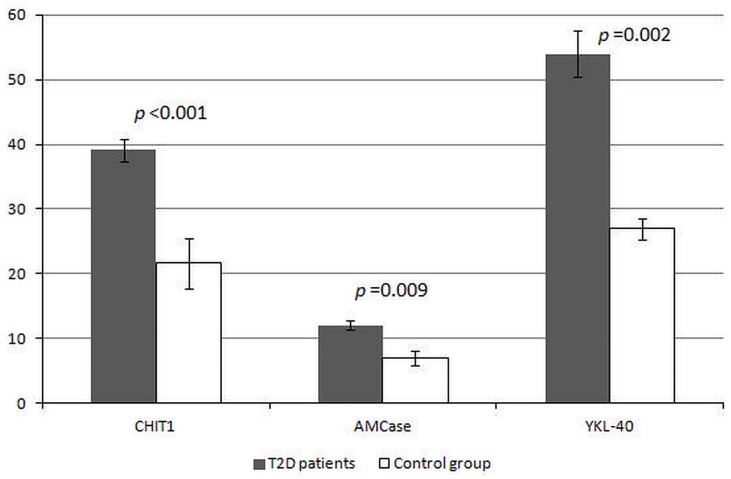
Fig 1. Levels of proteins from family 18 of glycosyl hydrolase in neutrophils of patients with type 2 diabetes and control subjects.
CHIT1—chitotriosidase activity expressed in nmol/h/106 cells, AMCase—acidic mammalianchitinase activity expressed in nmol/h/106 cells, YKL-40—chitinase 3-like protein 1 concentration expressed in ng/106 cells, T2D—type 2 diabetes; Data are presented as mean values ± standard error. On the y-axis appropriate units reflecting levels of examined proteins are indicated. The level of statistical significance of differences (p value) observed between T2D patients and the control group was evaluated by Mann-Whitney U test.

