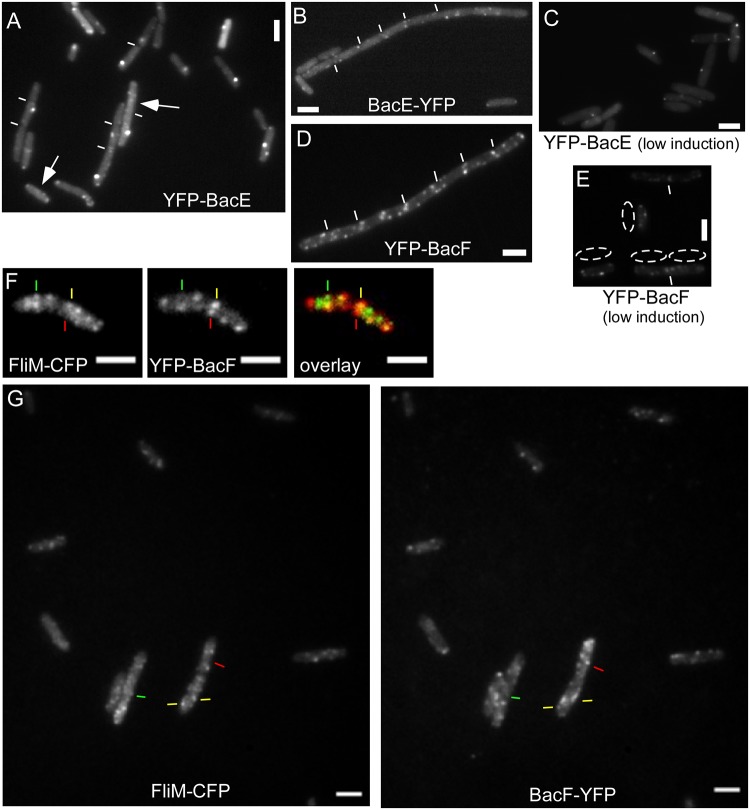
Fig 4. Localization of bactofilins in Bacillus subtilis cells during late exponential growth, expressing.
A) YFP-BacE (white lines indicate septa between cells), arrows indicate the presence of several additional foci of low fluorescence intensity, which can be observed in about 20% of the cells (JEA102), B) BacE-YFP (JEA101), C) YFP-BacE under very low induction (JEA102), D) YFP-BacF (JEA104), E) YFP-BacF under very low induction (JEA104), dotted areas indicate cells next to the regions, F) coexpression of FliM-CFP (green in overlay) and YFP-BacF (red in overlay), green lines localization of FliM-CFP with no YFP-BacF signal, red lines localization of YFP-BacF with no FliM-CFP signal, yellow lines colocalization of both signals (JEA109). G) Field of B. subtilis cells expressing FliM-CFP and YFP-BacF (JEA109), line color as in panel F). White bars 2 μm.

