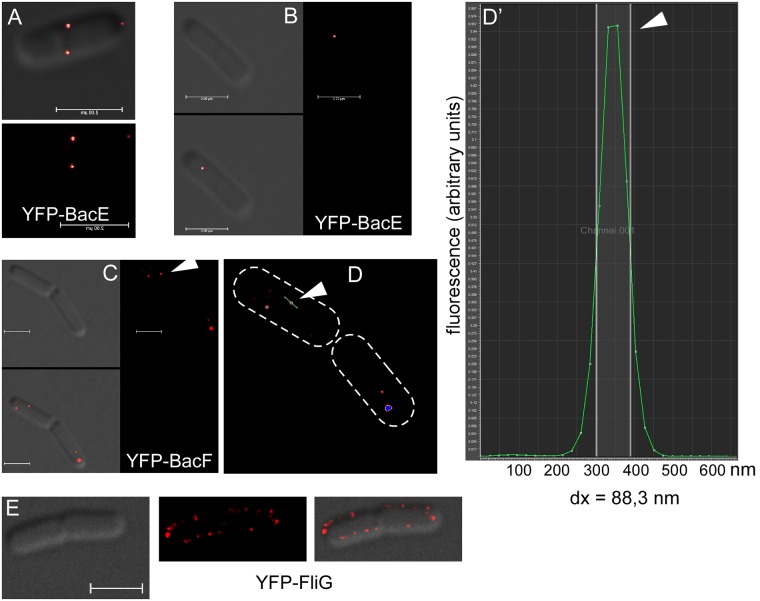
Fig 5. G-STED images in cells during late exponential growth A) and B) YFP-BacE (JEA102).
A) upper panel overlay of bright field and fluorescence, lower panel fluorrscence, B) left upper panel bright field, right panel fluorescence, lower panel overlay, note that the focus is on the surface of the cell, C) YFP-BacF (JEA104), triangle indicates focus that is measured in panel D, D) YFP-BacF fluorescence from panel C, cell outlines are indicated by dashed lines, triangle indicated line through the focus, whose intensity is shown in panel D’, D’) intensity histogram relative to cell length, green line fluorescence intensity in arbitrary units, half maximal fluorescence is indicated by white vertical lines, whose distance (dx) is the size of the focus, in this case 88.3 nm. E) YFP-FliG (JEA105), left panel bright field, middle panel fluorescence and right panel overlay. White bars 2 μm.

