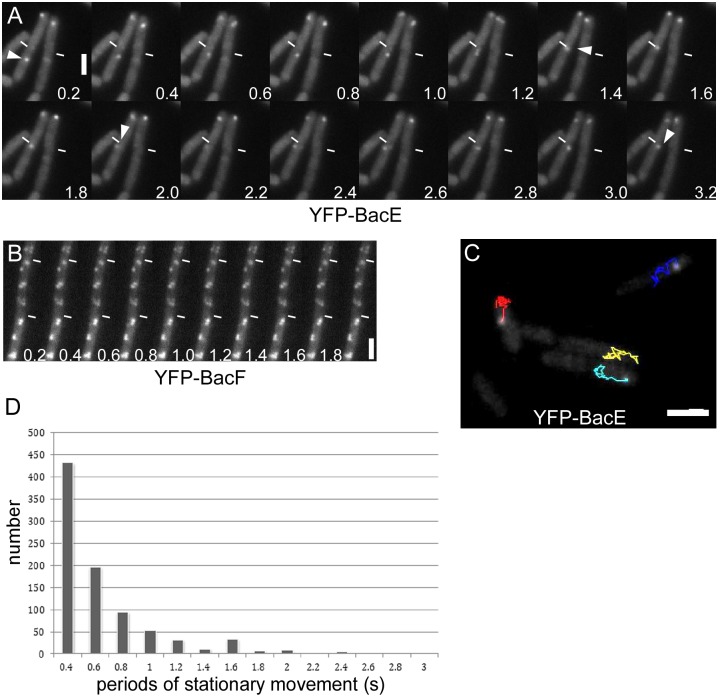
Fig 6. Dynamics of bactofilins in cells during late exponential growth.
A) and B) montages of 200 ms stream acquisitions of A) YFP-BacE (JEA102) and B) YFP-BacF (JEA104). Numbers indicate time in seconds. The white triangle indicates movement of a YFP-BacE signal. C) Tracking of YFP-BacE foci. Lines of different colors show tracks of individual signals (48 frames of a stream of 0.2 s intervals). D) Bar diagram shows the number of tracking points of a YFP-BacE molecule that arrest for a defined time interval as stated on the x-axis.

