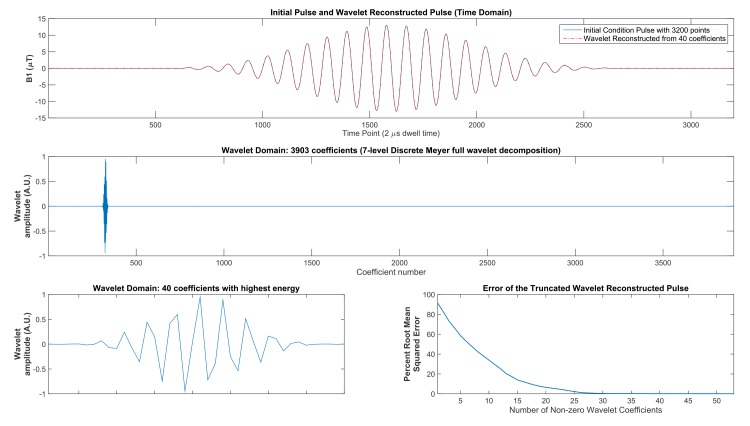
Fig 1. Wavelet compression of a time domain pulse.
A 2-band SMS purely amplitude modulated pulse is shown with the corresponding wavelet decomposition. This pulse was selected as the initial condition for the wavelet optimization. The top panel shows the initial condition pulse (blue trace) plotted against the pulse (dashed-dotted red trace) that was wavelet reconstructed exclusively from the 40 wavelet coefficients shown in the bottom panel. The middle panel provides the full wavelet decomposition (using Discrete Meyer wavelet prototypes) exhibiting the sparseness of the wavelet domain. The lower left panel shows the 40 highest energy wavelet coefficients (above the energy threshold of 0.001). The lower right panel plots the root mean squared error (RSME) percentage of the initial condition pulse compared to the wavelet reconstructed pulse after truncation in the wavelet domain to a limited number of coefficients and zero-filling the remainder of the wavelet domain. In this figure, 3200 time domain points were compressed to 40 wavelet domain coefficients representing 98.7% compression of the original time domain pulse.

