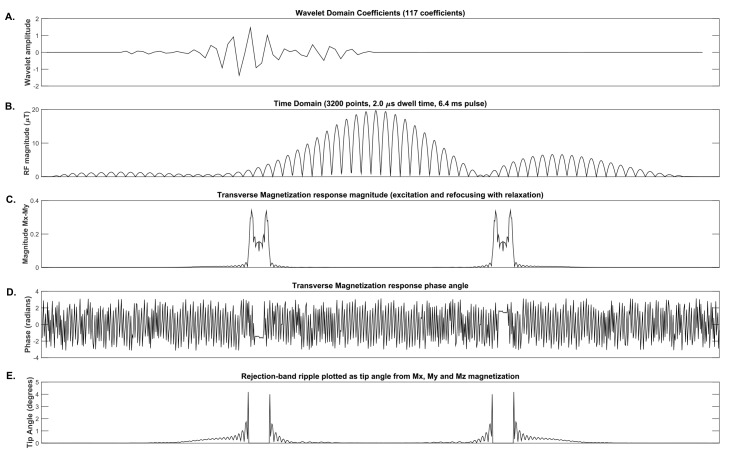
Fig 3. Graphical display of wavelet coefficients and cost function terms for a 2-band pulse.
Panel (A) at the top shows the 117 wavelet domain coefficients whose amplitudes were optimized. The amplitude modulated time domain pulse with 3200 points shown in panel (B) was generated from the wavelet coefficients displayed in the top panel. Panel (C) shows the transverse magnetization profile at the echo time after Bloch Simulation of excitation and refocusing pulses. Panel (D) displays the phase of the transverse magnetization at the echo time. Panel (E) shows the tip angle for solely the rejection band that was dynamically computed from the net magnetization vector. The lower three plots represent the spin magnetization state from Bloch simulation for a single spin isochromat on resonance at each spatial frequency point.

