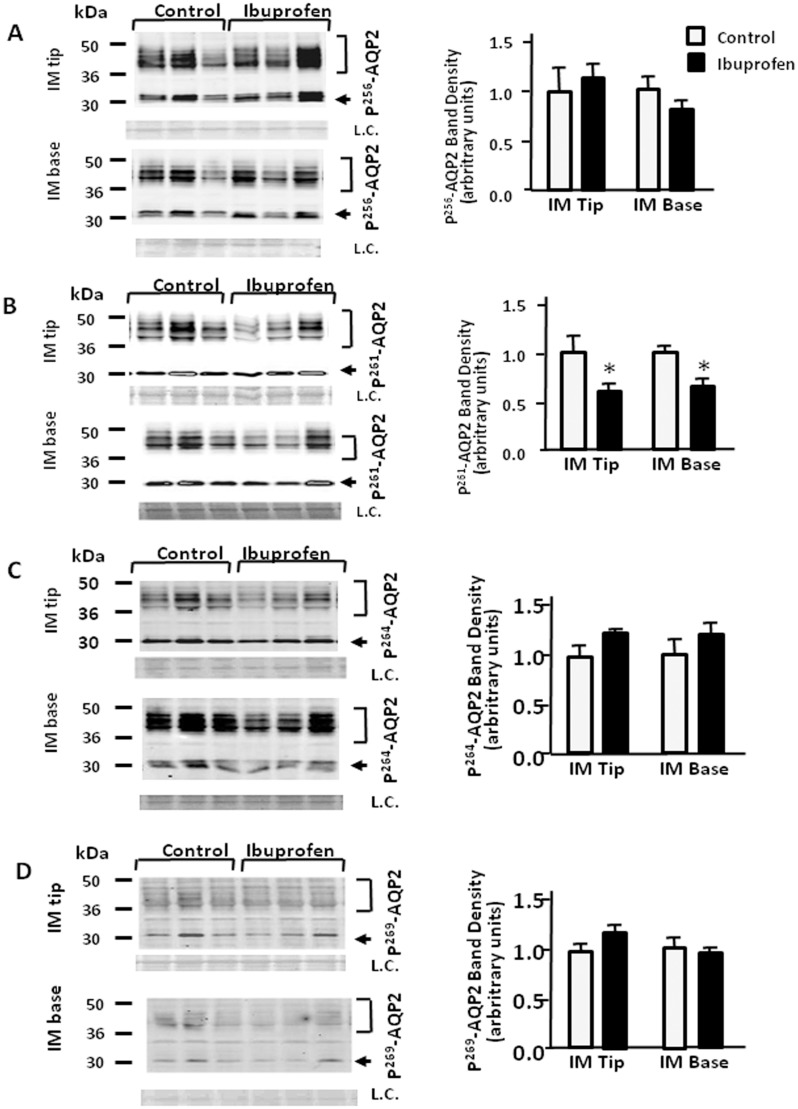
Fig 6. Effect of ibuprofen on the phosphorylated forms of AQP2.
Tissue samples were isolated from rat IM tip and base after 14 days treatment without or with ibuprofen (5 mg/kg). and analyzed by Western blot for phosphorylated AQP2 (arrows) as follows: (A) p256AQP2, (B) p261AQP2, (C) p264AQP2 and (D) p269AQP2. Left panels provide representative Western blots. The top bracket shows 35–50 kDa glycosylated forms; the bottom arrow designates the 29 kDa unglycosylated AQP2. L.C. = loading control. Right bar graphs show phosphoAQP2 combined densitometry from n = 12 rats per group. All proteins were normalized to loading controls. White bars, control; black bars, ibuprofen treated. Bars = Mean ± SEM; *P<0.05 compared with control rats.

