
Figure 1.
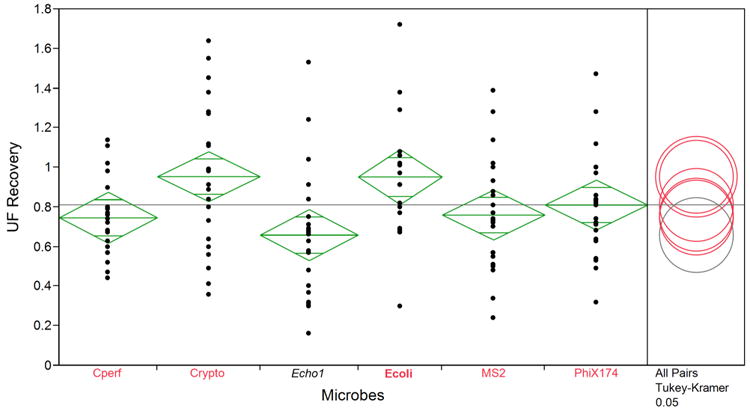
One-way ANOVA for UF percent recovery. Diamonds represent means (line near the center of each diamond), with 95% confidence intervals for each mean (the vertical span), based on the pooled estimate of the standard error. Comparison circles summarize the results of the multiple comparison procedure. The selected mean has bold, red circle and variable label (in this Figure, E. coli). Means that are not significantly different from the selected mean have unbolded, red circles and variable labels. Means that are significantly different from the selected mean have gray circles and gray italicized variable labels. In this example, the mean for E. coli is significantly different from the mean for echovirus 1, but is not significantly different from the mean for other microbes.