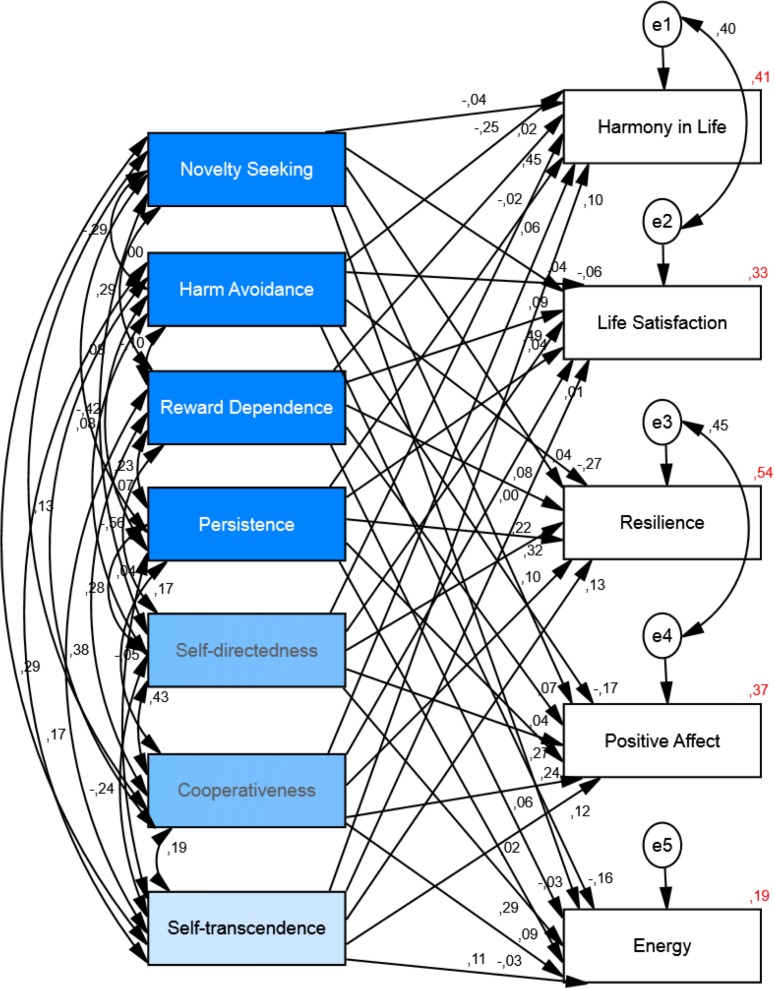
Figure 4. Structural equation model of the relationship between personality and well-being.
The model shows the correlations among personality variables and the paths from personality to well-being and their standardized parameter estimates. Chi-square = 140.04, df = 8, p < .001; goodness of fit index = .96; incremental fit index = .94; comparative fit index = .94 and normed fit index = .94, (N = 524).

