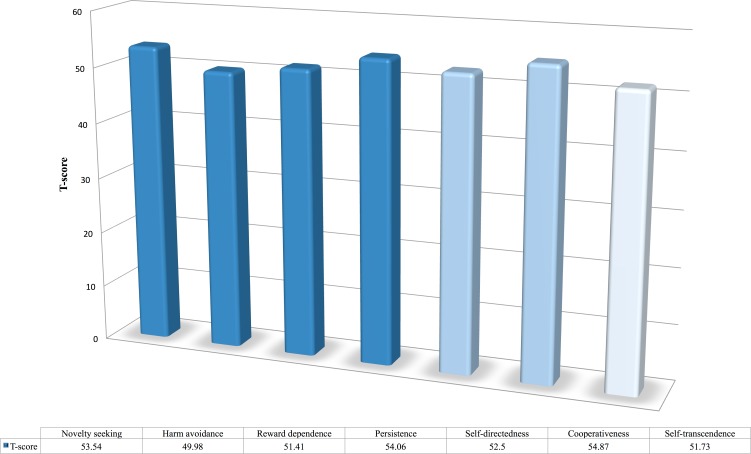
Figure 7. Osteopathic patients’ T-scores in the seven personality dimensions.
A T-score of 50 represents the mean of the population in relation to the control group. 10 points indicate one standard deviation. In other words, deviations of 10 points above or below 50 indicate deviations of one standard deviation from the non-patient group’s mean.

