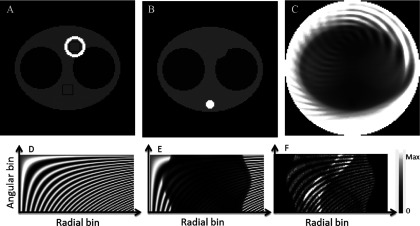
FIG. 1.

(A) Simulated emission phantom. Activity values are 1 (“background”), 10 (“heart”), 0.2 (“lungs”), and 0 elsewhere. Two 8 by 8 black pixel squares correspond to two ROIs used for evaluation. (B) Attenuation: 0.009 66/mm (background tissues), 0.002 66/mm (lungs), 0.0187/mm (“spine”), and 0 elsewhere. (C) Sensitivity image, (D) sinogram of artificially created normalization factors, and (E) sinogram of normalization and attenuation factors. (F) Sinogram of the projections of the emission phantom multiplied by the normalization and attenuation factors for 100 000 total counts.
