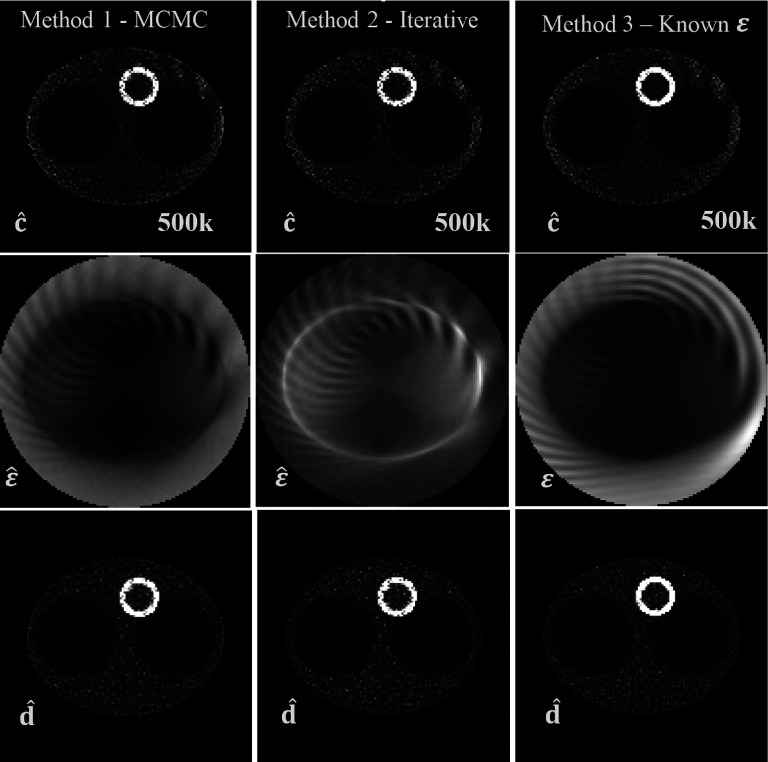
FIG. 3.
Results for the moderate-count (500k) experiment with TOF resolution 6 cm FWHM. Top row: image of c estimate obtained using three different approaches for the sensitivity estimation: using the MCMC of Sec. 2.B (left), using the fixed-point iterative algorithm of Sec. 2.C (middle), when true attenuation and normalization were used (right). Middle row: respective sensitivity estimates and true sensitivity used in method 3. Bottom row: images of estimates of d.

