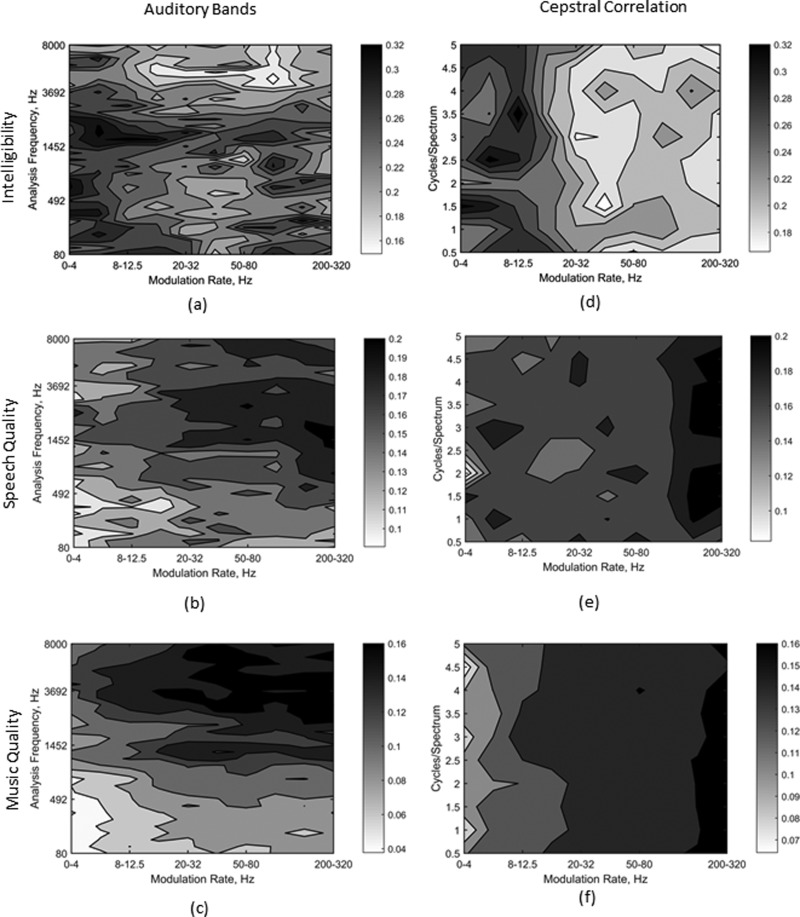
FIG. 5.
Contour plots showing the uncertainty coefficients between the envelope information and the subject intelligibility scores or quality ratings for NH listeners. The left column (a)–(c) is for envelope modulation rate measured in each auditory frequency band, while the right column (d)–(f) is for the short-time spectrum fit with the cepstral correlation basis functions. The top row (a), (d) shows sentence intelligibility, the second row (b), (e) shows sentence quality, and the third row (c), (f) shows music quality.

