
Fig. 1.
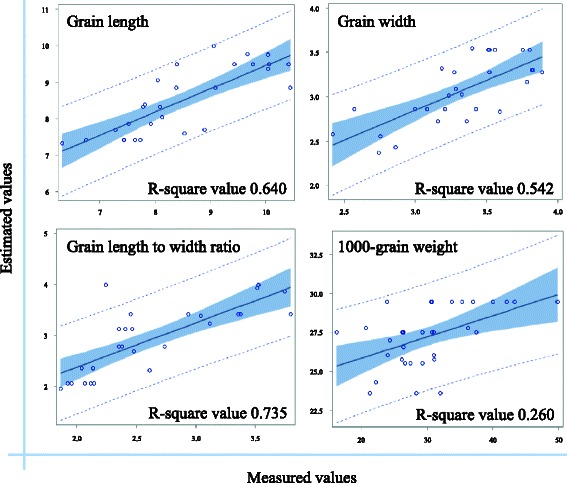
Validation of the regression equation model. The regression equation model was evaluated by comparing estimated values with actual measured values for four grain size-related traits (GL, GW, LWR, and KGW). The x-axis indicates measured values and the y-axis indicates estimated values. The dotted line indicates the 95 % prediction limits, the blue-shaded region indicates the 95 % confidence limits, and the solid line indicates the best prediction from the model