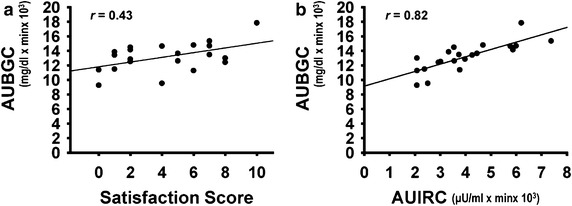
Fig. 2.

Correlations among satisfaction scores, area under blood glucose curves and serum immunoreactive insulin curves. a AUBGC correlates with satisfaction score (P = 0.05). b AUBGC correlates with area under curve of time-course change in IRI (AUIRC) (P = 0.0002). N = 21, Spearman’s rank-correlation coefficient tests. AUBGC area under blood glucose curve, AUIRC curve of changes in IRI, BGL blood glucose level, IRI serum immunoreactive insulin
