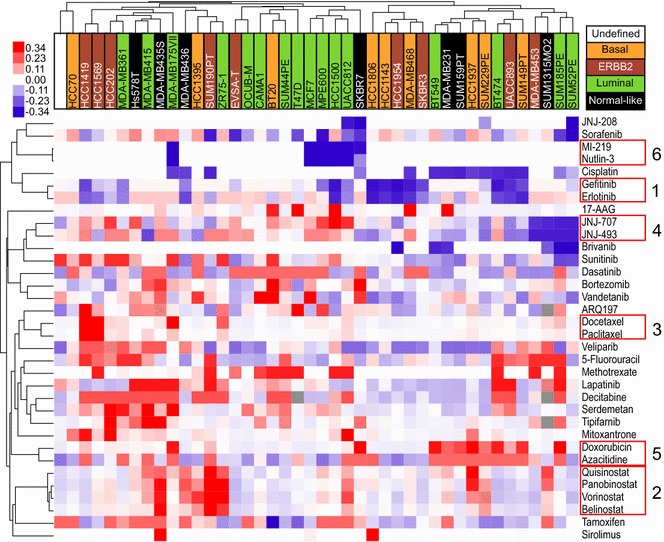
Fig. 2.

Similar drugs cluster together. Depicted is a hierarchical unsupervised clustering of the analyzable drugs and cell lines. Blue color indicates low IC50 values (i.e. cells are drug-sensitive), and red color high IC50 values (i.e. cells are drug-resistant). Color intensity illustrates the degree of drug sensitivity or resistance; outliers exceeding the legend boundaries are set to the maxima colors of the legend to ensure visibility of small differences instead of few outliers. Breast-cancer subtypes are color-coded on the basis of the intrinsic subtypes of breast cancer cell lines as previously described (Riaz et al. 2013). The respective legend can be found on the top right. Tree distance is representative for similarity of drugs or cell lines. Drugs with similar response profiles among the cell lines are highlighted by red boxes
