Fig. 7.

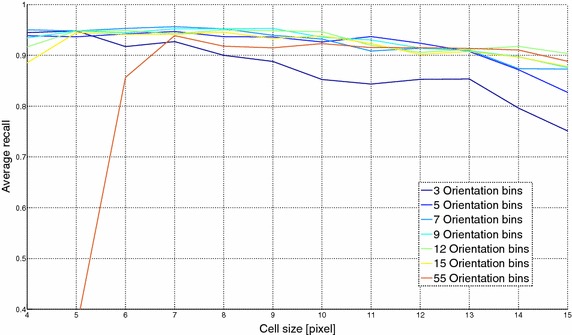
FER results using different cell sizes and number of orientation bins for the HOG descriptor: the x-axis reports the cell size in pixel and the y-axis refers to the average recall percentage

FER results using different cell sizes and number of orientation bins for the HOG descriptor: the x-axis reports the cell size in pixel and the y-axis refers to the average recall percentage