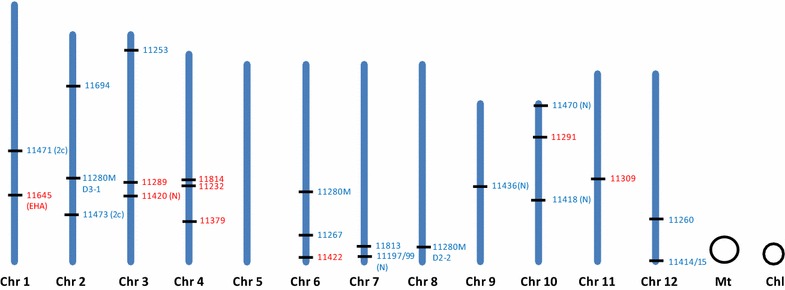
Fig. 3.

Map positions of T-DNA insertions derived from independent transgenic lines. The 12 rice chromosomes are displayed in blue; mitochondrial and chloroplast DNA are indicated as black circles. T-DNA insertions belonging to E. adhaerens and A. tumefaciens are indicated in blue and red respectively
