FIG 1.
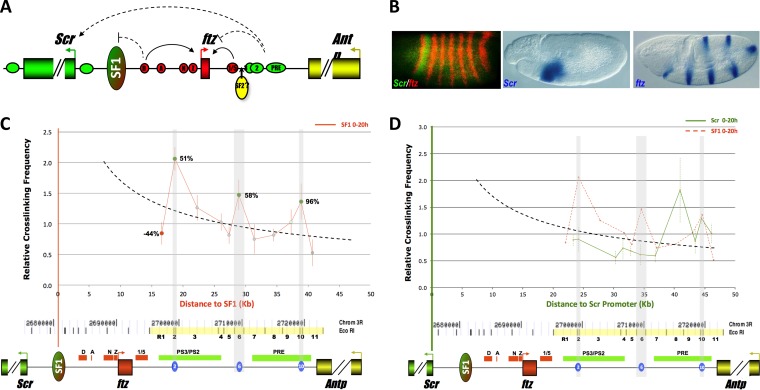
Identification of SF1-tethering elements (STEs) in the Drosophila ftz-Antp interval. (A) Diagram of genomic region containing the Scr (green), ftz (red), and Antp (yellow) genes. Filled boxes, arrowheads, and horizontal ovals represent genes, promoters, and enhancers, respectively. Red enhancers: D, ftz distal; A, ftz AE1; N, ftz neurogenic; Z, ftz zebra; and 1/5, ftz stripe 1/5 enhancer. Green enhancers: 3, Scr PS3; 2, Scr PS2; and PRE, Scr PRE. Vertical oval, SF1; curved arrows, enhancer-promoter interactions; dashed arrows, interactions that could be modulated by SF1. (B) Scr and ftz are expressed in distinct patterns. Shown are images from whole-mount in situ hybridization showing patterns of Scr and ftz in stage 5 (left) and stage 11 (center and right) embryos. Probes used in hybridization are indicated at the bottoms of the photos. (C) SF1 boundary interacts with multiple DNA elements in the ftz-Antp (FA) interval. 3C capture frequencies between SF1 and R1 to R11 elements were quantitated by conventional PCR and plotted over distance. Dashed curve, a distance-frequency power trend line (see Materials and Methods). Elements captured at a frequency above, near, or below the expected value are in green, gray, and red, respectively. The difference between observed and expected capture frequencies is indicated as a percentage for R1, R2, R6, and R10. The gray-shaded vertical regions correspond to the three STEs. A genomic map of the Scr-Antp region, drawn to scale, is shown below with EcoRI sites. R1 to R11 elements are marked in yellow and labeled numerically. Genes and their regulatory elements are shown as horizontal bars; red, ftz; green, Scr, see panel A. Three STEs are shown as blue ovals. (D) Distinct FA elements interact with the Scr promoter. 3C capture frequencies between the Scr promoter and R1 to R11 elements were quantitated by conventional PCR and plotted over distance. Dashed curve, a distance-frequency power trend line; red dashed line, capture profile of SF1.

