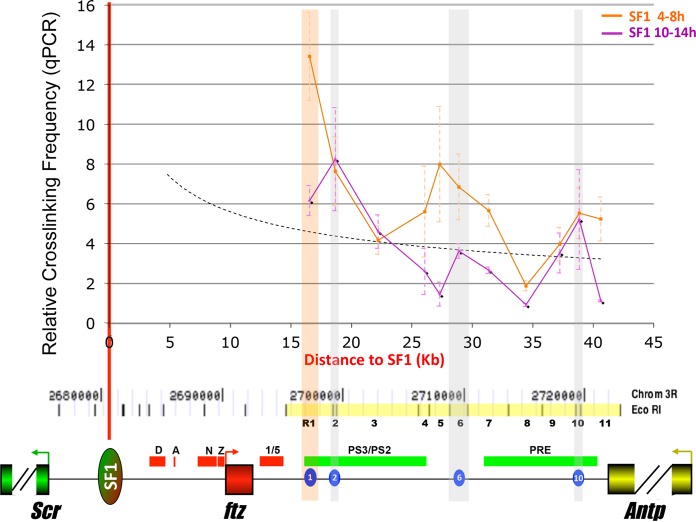
FIG 4.
SF1-STE associations are developmentally regulated. 3C capture frequencies between SF1 and R1-R11 in 4-h to 8-h (orange line) and 10-h to 14-h (purple line) embryos were quantitated by qPCR and plotted over distance. Dashed curve, a distance-frequency trend line generated by qPCR. Vertical shaded bars indicate regions of STEs (orange, R1; gray, R2, R6, and R10). At the bottom, a genomic map of the Scr-Antp region, drawn to scale, is shown with EcoRI sites. R1 to R11 elements are marked in yellow and labeled numerically (see Fig. 1C). STEs are shown as blue ovals.

