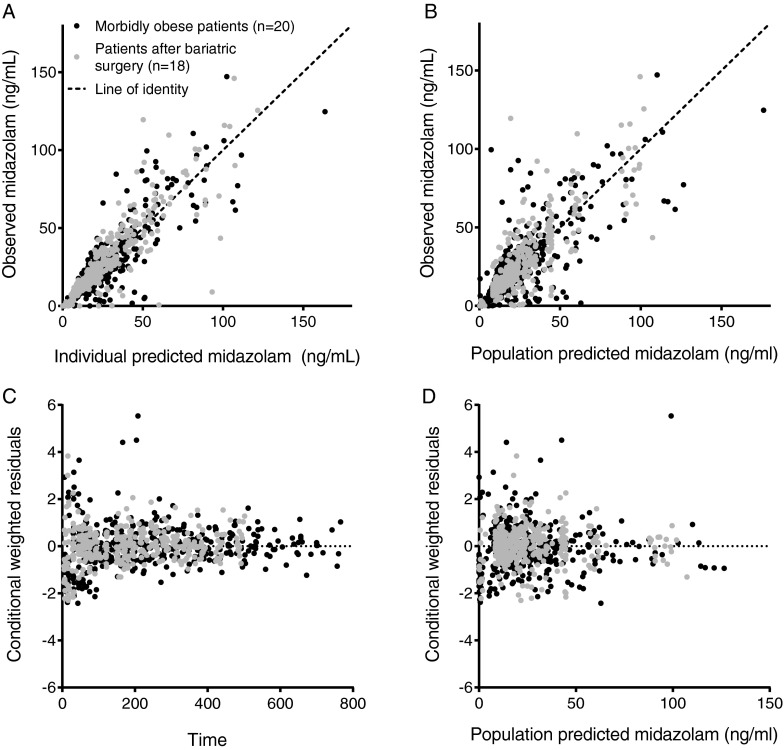
Fig. 2.
Observed versus individual predicted midazolam concentrations (a), observed versus population predicted midazolam concentrations (b), conditional weighted residuals (CWRES) versus time (c) and population predicted midazolam concentrations (d) of the final model for 20 morbidly obese patients (black dots, occasion 1) of which 18 returned 1 year post surgery for a second study visit (grey dots, occasion 2). The dashed line represents the line of identity (x = y).

