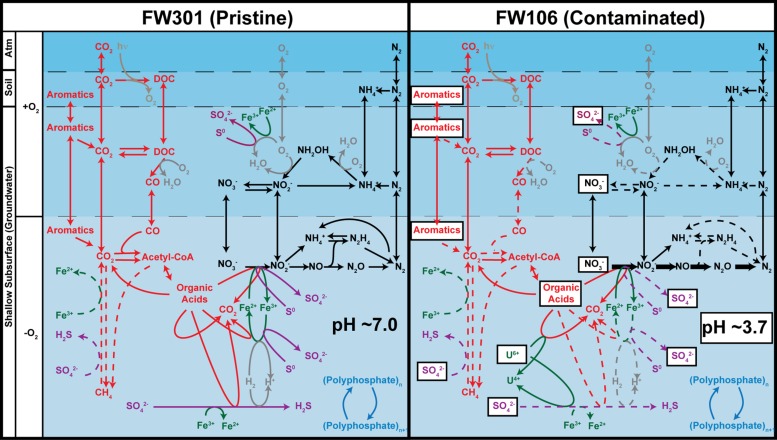
FIGURE 4.
Predicted geochemical cycling in the FRC subsurface based on metabolic profiles of pristine (FW301, left) and contaminated (FW106, right). The denitrification pathway genes are labeled in bold in the FW106 figure to indicate their overabundance in this metagenome compared to FW301. Dotted lines indicate either that the pathway genes were not detected in the metagenomes, detected in very low abundance, or that bacteria known to implement these pathways were not detected or in extremely low abundance (<1%). Contaminants present in high concentrations at the FW106 site are shown in white boxes. Partitions indicate different geochemical and electrochemical environments that may transiently exist at the OR-IFRC sites and do not necessarily represent the specific environmental partitioning present in these environments.

