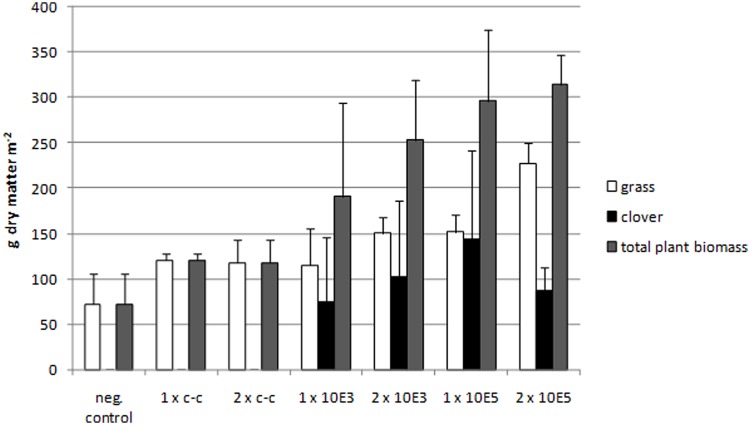
FIGURE 2.
Measurements of clover, grass, and total biomass dry matter of the field experiment in the second year. An increase of total biomass depending on the amount of spores applied can be seen. Negative control: no compost amendment; 1xc-c: compost control, one application; 2xc-c: compost control, two applications; 1x10E3: compost with 103 C. botulinum spores g-1, one application; 2x10E3: compost with 103 C. botulinum spores g-1, two applications; 1x10E5: compost with 105 C. botulinum spores g-1, one application; 2x10E5: compost with 105 C. botulinum spores g-1, two applications. From each treatment (with botulinum spores in the two concentrations and the compost and negative control) we had four replicates in the field trial (N = 4). On each plot we randomly placed a square frame (30 cm length) three times and collected all plants (above soil) within the frame. Clover and grass were separated manually. We determined the dry matter clover/grass for each plot individually. The values plotted in the graph show the arithmetic mean of the four respective plots and the standard deviation. Negative control: Grass and total plant biomass: Mean ± SEM: 72,215 ± 34,225. 1xc-c: Grass and total plant biomass: Mean ± SEM: 120,544 ± 7,070. 2xc-c: Grass and total plant biomass: Mean ± SEM: 117,766 ± 25,897. 1x10E3: Grass: Mean ± SEM: 115,544 ± 39,763. 1x10E3: Clover: Mean ± SEM: 75,178 ± 71,003. 1x10E3: Total plant biomass: Mean ± SEM: 190,722 ± 103,462. 2x10E3: Grass: Mean ± SEM: 150,726 ± 17,787. 2x10E3: Clover: Mean ± SEM: 102,212 ± 83,886. 2x10E3: Total plant biomass: Mean ± SEM: 252,938 ± 66,124. 1x10E5: Grass: Mean ± SEM: 151,837 ± 19,157. 1x10E5: Clover: Mean ± SEM: 144,43 ± 79,591. 1x10E5: Total plant biomass: Mean ± SEM: 296,267 ± 78,444. 2x10E5: Grass: Mean ± SEM: 227,385 ± 22,450. 2x10E5: Clover: Mean ± SEM: 87,028 ± 26,322. 2x10E5: Total plant biomass: Mean ± SEM: 314,413 ± 32,826.

