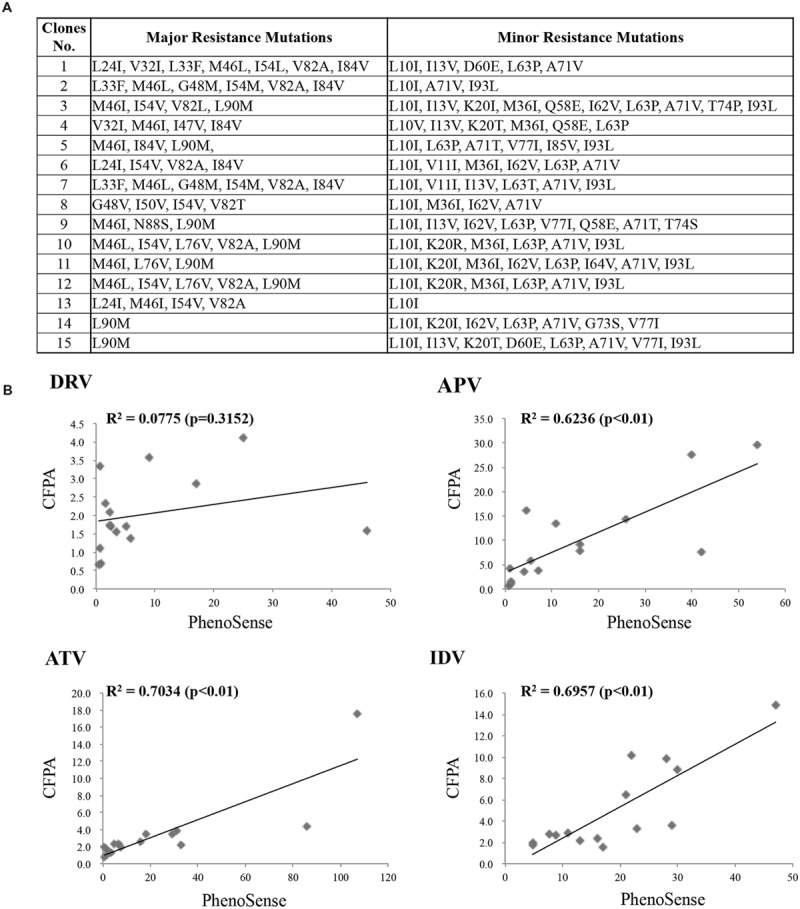
FIGURE 5.

Comparison of CFDSA with the PhenoSense assay. (A) Information about the PR mutants used in this assay. (B) Assessment of drug susceptibility and resistance determined by CFDSA, compared to those determined by the PhenoSense® assay. The y-axis indicates CFDSA drug-resistant scores, whereas the x-axis represents PhenoSense® scores.
