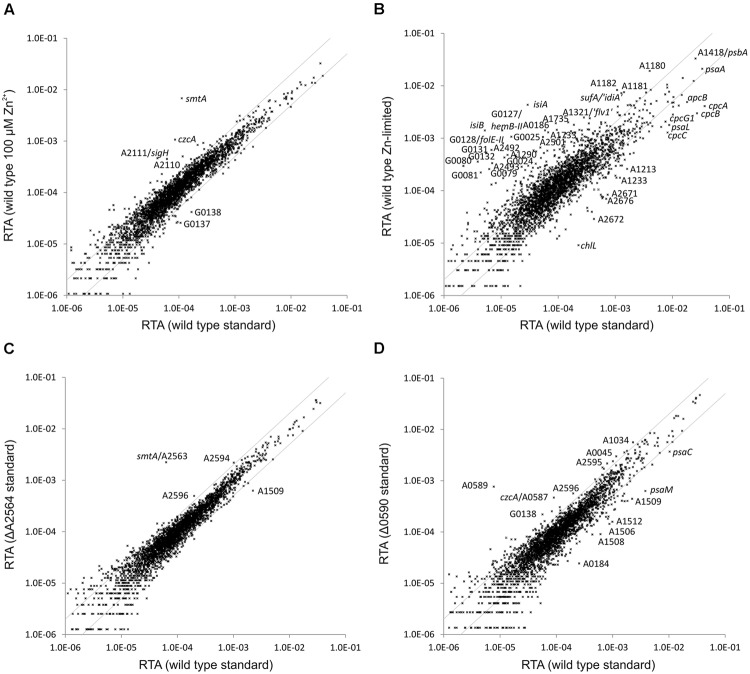
FIGURE 4.
Relative transcript abundances for Synechococcus 7002 wild type cultures grown at altered zinc levels compared to standard growth conditions and of the SYNPCC7002_A2564 (smtB) and SYNPCC7002_A0590 deletion mutants compared to the Synechococcus 7002 wild type. The scatter plots show (A) the RTAs of a wild type Synechococcus 7002 culture grown in presence of high zinc (102 μM) compared to a culture grown under standard conditions; (B) the RTAs of a culture of wild type Synechococcus 7002 culture grown under zinc limitation compared to a culture grown under standard conditions; (C) RTAs of the SYNPCC7002_A2564 (smtB) deletion mutant compared to the wild type, both grown under standard conditions; (D) RTAs of the SYNPCC7002_A0590 deletion mutant compared to a wild type culture, both grown under standard conditions. The values for the wild type under standard conditions were calculated as the mean of three independent biological replicates. The gray lines show twofold changes in either direction. Selected genes are identified by gene locus or abbreviated locus tag number. For details, see text.

