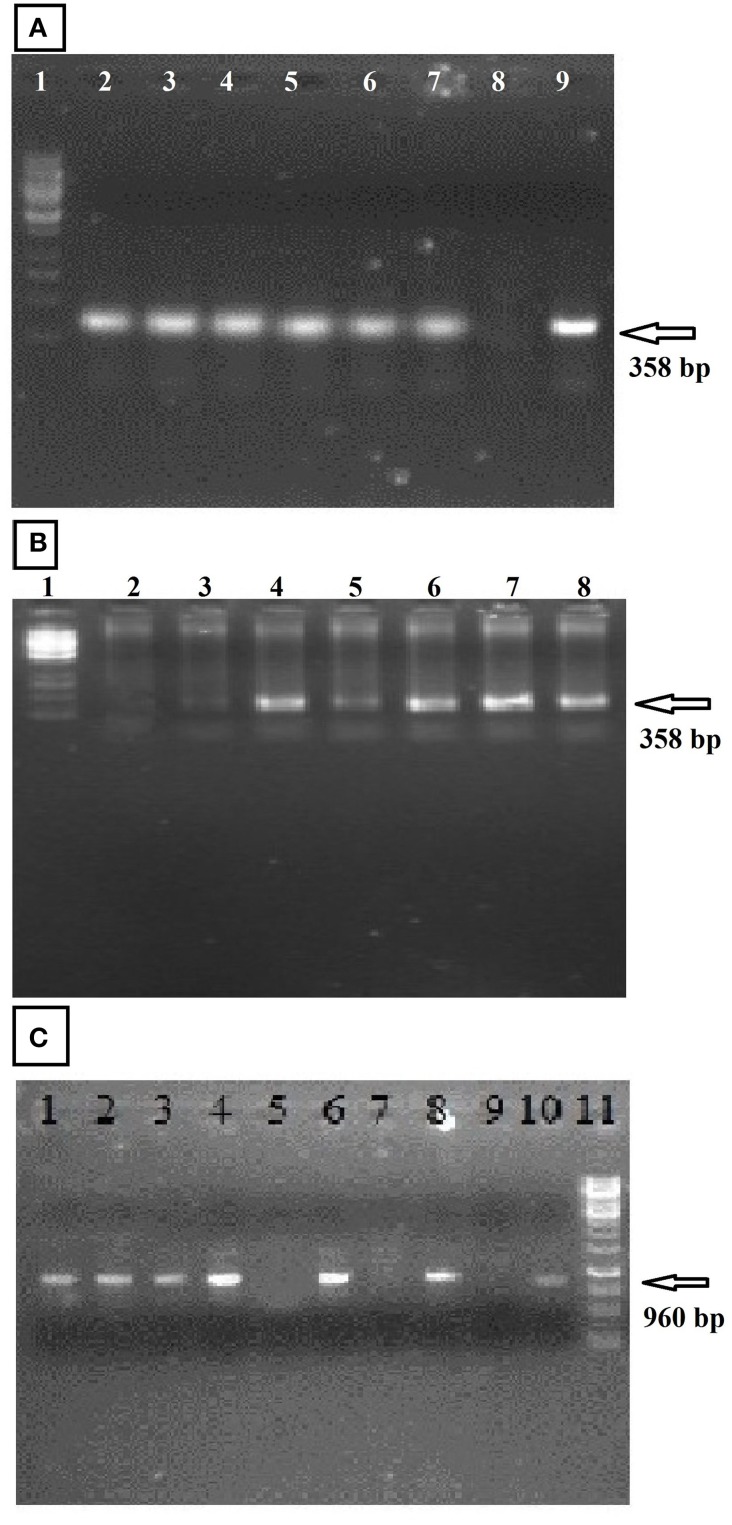
Figure 2.
PCR amplification of transgenic cotton plants during three generations (Fiber Gene GhEXPA8). (A) represented the PCR amplification of transgenic cotton plants at T0 generation, lane 1: 1 kb DNA marker, lane 2–7: transgenic cotton plants, Lane 8: Negative Control, Lane 9: Positive Control; (B) PCR amplification of transgenic cotton plants during T1 generation, lane 1: 1 kb DNA marker, lane 2: negative control, lane 3–8: transgenic cotton plants; (C) During T2 generation Lane 1–8 show putative transgenic plants in which lane 1, 2, 3, 4, 6, and 8 show positive transgenic plants having gene amplification from orientation primers resulting in band of 960 bp whereas, Lane 5 and 7: untransformed cotton (negative amplification), Lane 9: DNA from untransformed cotton (Negative Control), Lane 10: DNA from pGA482-GhEXPA8 (Positive Control), lane 11:1 kb DNA ladder Whereas, the arrow indicate the detection of gene in transgenic cotton plants.

