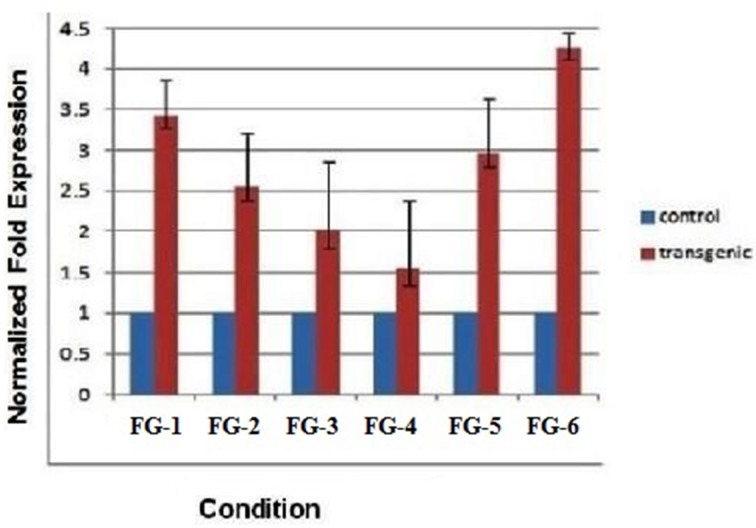
Figure 5.
Quantitative real time PCR to determine the expression of transgenic cotton plants (Fiber Gene GhEXPA8). Lines FG-8-1, FG-8-4, FG-8-5, FG-8-11, FG-8-13, and FG-8-15: described the different expression levels of transgenic and control mRNA samples, blue color represent the expression level of control plant samples (mRNA of untransformed cotton), red color indicated the mRNA expression level of putative transgenic lanes, GAPDH was used as an internal control for normalization.

