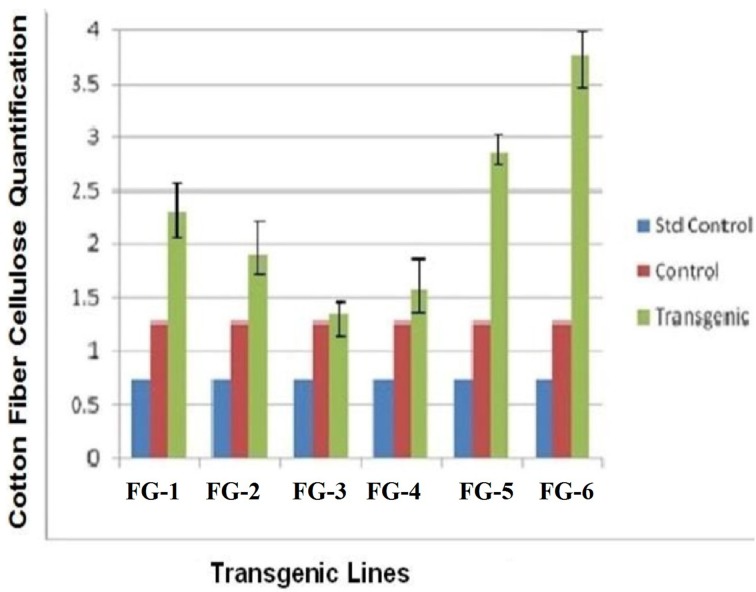
Figure 6.
Comparison of cellulose contents of transgenic and control cotton fiber along with standard control. Plants in groups 1 to 6 were showed three different samples of cellulose. Blue color represent the amount of cellulose from Avicel PH-101pure cellulose, red color represent the amount of cellulose obtained from untransformed cotton, green color indicated the depicts the presence of cellulose in transgenic cotton.

