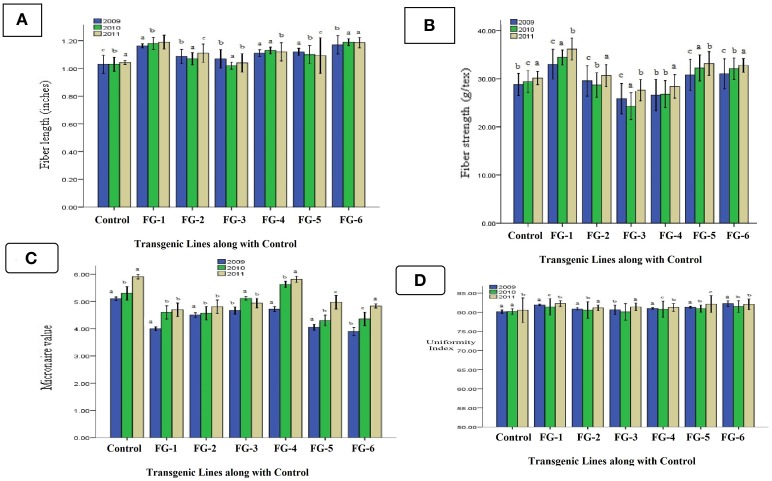
Figure 7.
Comparison of fiber length, fiber strength, fiber micronaire value, and fiber uniformity index of transgenic cotton plants with control (T0, T1, and T2): fiber length (A), fiber strength (B), fiber micronaire value (C), and fiber uniformity index (D) of different transgenic cotton plants T0, T1, and T2 in generations of 2009, 2010, and 2011, blue color represent fiber analysis at T0 generation, green color indicated fiber analysis at T1 generation, brown color highlight fiber analysis at T2 generation. Note: Bar Determined the Standard Error.

