Figure 4.
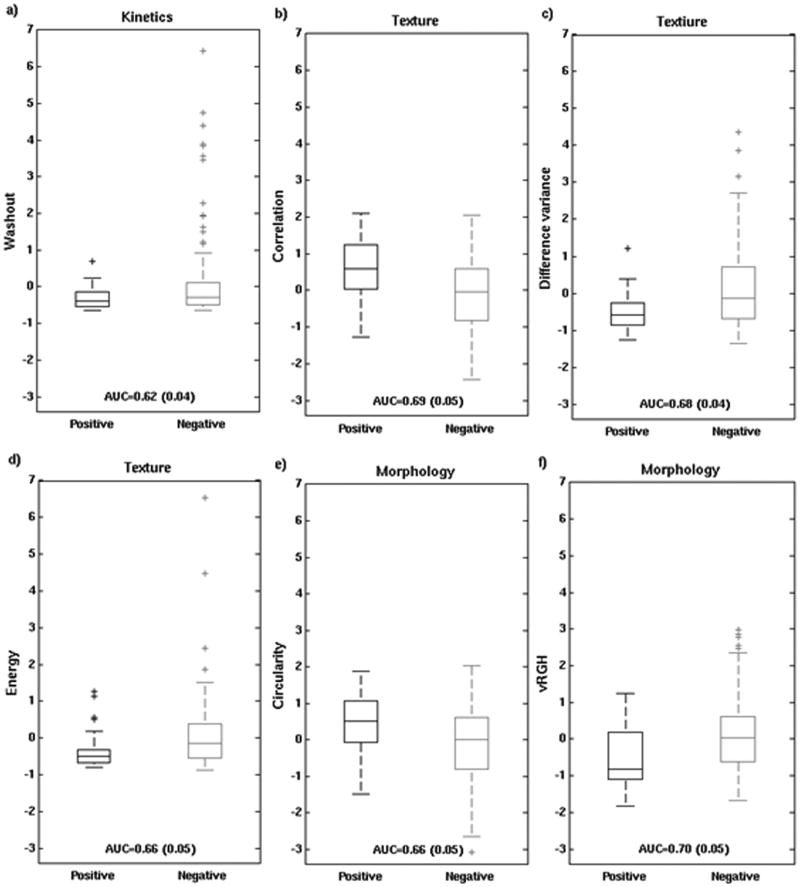
Box plots of feature values for positive and negative nodes (after standardization to zero mean and unit standard deviation for the entire dataset): a) the most discriminatory kinetic feature (washout), and the 5 best performing features, i.e., 3 textural (b-d) and 2 morphological (e-f). On each box, the central mark is the median, the edges of the box are the 25th and 75th percentiles, the whiskers extend to the most extreme data points not considered outliers, and outliers are plotted individually.

